Version checked for this guide: 1.0.6 · 2026-09-23
Use an appropriately cleaned dataset and a prespecified comparison. Keep QC/Blank samples out of biological hypothesis tests. Use transformations and scaling for the purpose at hand: PCA scaling does not mean fold changes should be calculated from scaled values.
run_pca() returns a PCA model; pca_score_plot() visualizes scores. mutate_fc() calculates case/control fold change using a mean or median summary. mutate_p_value() supports t and Wilcoxon tests and adds multiple-testing adjusted results. Match paired samples explicitly before a paired test. The example is an independent-group comparison and takes its group labels from sample metadata. These massstat interfaces require at least three samples per comparison group.
Additional functions cover heatmaps, correlations, distances, graph conversion, PLS and PLS-DA. Supervised separation on training data is not predictive validation: use appropriate held-out or nested validation and avoid selecting features before splitting the data.
Visual guide: the route through this chapter
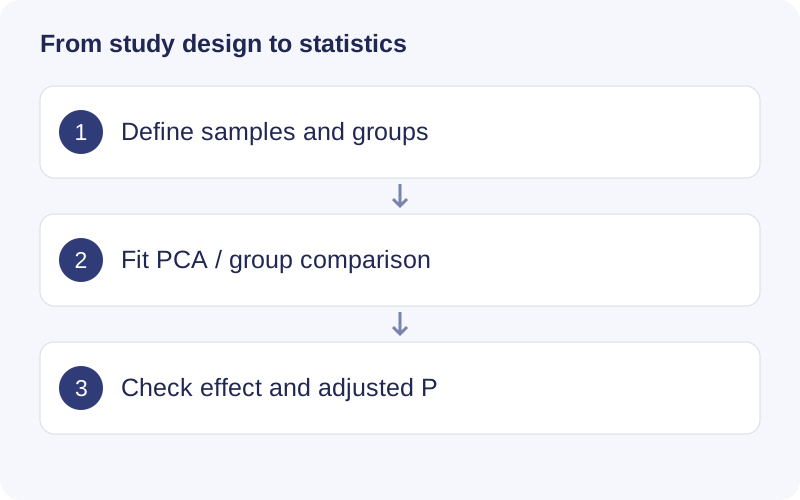
Before testing, write down which group is numerator and which is denominator. Inspect sample counts, pairing and transformation. Read effect size together with adjusted P values, then return to peak evidence for important features. PCA separation alone is not a hypothesis test.
Functional scope
PCA and scaling; fold change and hypothesis tests; volcano plots and heatmaps; correlations, distances and graphs; PLS/PLS-DA.
Example
si <- massdataset::extract_sample_info(normalized)
control <- si$sample_id[si$group == "Control"]
case <- si$sample_id[si$group == "Treatment"]
# Replace labels to match your experimental design.
if (length(control) >= 3 && length(case) >= 3) {
  stats_object <- massstat::mutate_fc(normalized, control, case,
                                     mean_median = "mean")
  stats_object <- massstat::mutate_p_value(stats_object, control, case,
    method = "t.test", p_adjust_methods = "BH")
  write.csv(massdataset::extract_variable_info(stats_object),
            "feature_statistics.csv", row.names = FALSE)
}
Find a function
The checked source exports the following APIs, including compatibility interfaces and utilities. Consult the installed version with help("function_name", package = "massstat") for argument details.
Show exported functions
Heatmap, convert_dummy_variable, convert_mass_dataset2graph, cor_mass_dataset, dist_mass_dataset, massstat_conflicts, massstat_logo, massstat_packages, mutate_fc, mutate_p_value, pca_score_plot, pls, plsda, run_pca, scale_data, scale_data1, scale_data2, volcano_plot
Package source and reference documentation · Complete workflow
Walkthrough: Read an explicitly scaled PCA
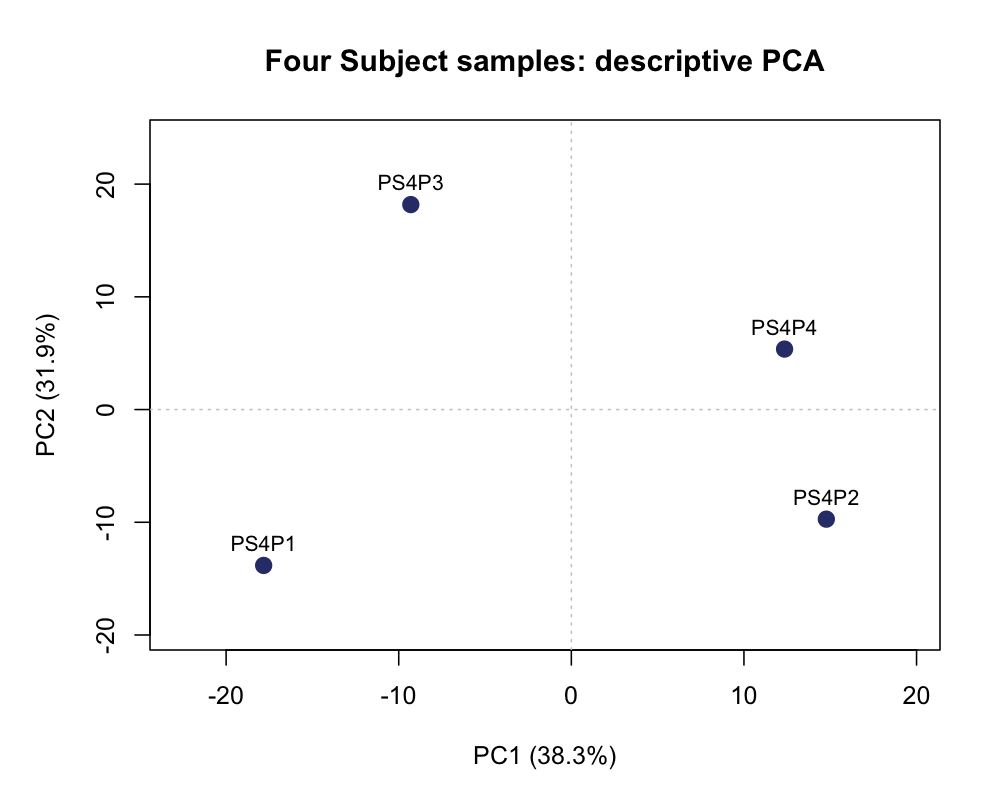
- Each point is a sample; axis percentages describe variance captured by each principal component.
- The example uses prcomp with center = TRUE and scale. = TRUE after preprocessing, retaining finite, nonconstant features.
- Do not call a cluster significant from this plot. Use a valid experimental design and the appropriate inferential test for a group comparison.