Version checked for this guide: 1.0.8 · 2026-09-23
Quality assessment is useful before and after cleaning. Give massqc a mass_dataset with correct sample classes, batches and injection order. Generate a report into a new output directory and retain the object used to create it.
Review missingness by sample and feature, intensity distributions, QC RSD, correlations and PCA. A QC RSD needs actual quantitative QC replicates. A low RSD does not establish metabolite identity, and an unusual PCA point may represent biology. Report which input state was assessed: imputation and normalization affect the metrics.
HTML reporting requires the report-rendering dependencies available in your R environment; PDF adds its document toolchain. If rendering fails, inspect the log and produce individual diagnostic plots while resolving the missing renderer.
Visual guide: the route through this chapter
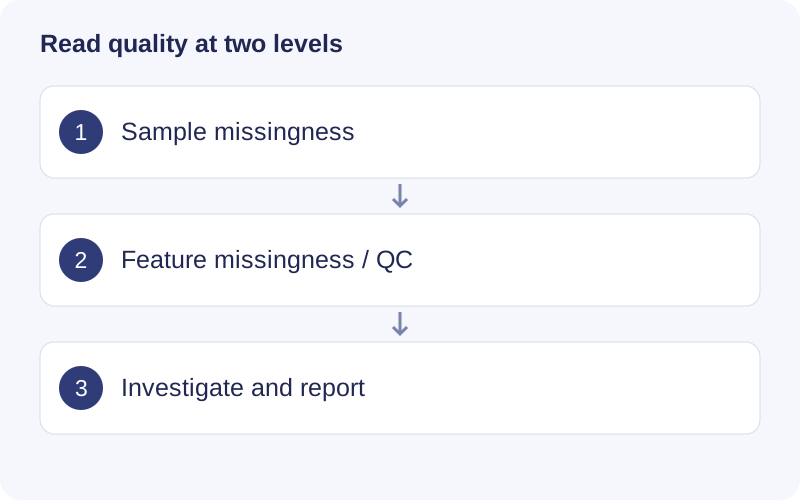
A sample with much more missing data may have an acquisition problem; a feature missing from many samples may be unsuitable for the planned analysis. Review these separately. Generate before/after reports from explicitly saved objects, so that any improvement can be traced to a processing step.
Functional scope
HTML/PDF reports; sample and feature missingness; m/z–RT distributions; RSD curves; intensity boxplots; PCA and sample correlations.
Example
# Requires object and the report-rendering dependencies.
# massqc::massqc_report(object, path = "qc_before", type = "html")
massqc::show_sample_missing_values(object)
massqc::show_variable_missing_values(object)
Find a function
The checked source exports the following APIs, including compatibility interfaces and utilities. Consult the installed version with help("function_name", package = "massqc") for argument details.
Show exported functions
extract_expression_data, extract_process_info, extract_sample_info, extract_variable_info, get_mv_number, massqc_conflicts, massqc_cumulative_rsd_plot, massqc_logo, massqc_packages, massqc_pca, massqc_pca_pc1, massqc_report, massqc_rsd_plot, massqc_sample_boxplot, massqc_sample_correlation, show_missing_values, show_mz_rt_plot, show_sample_missing_values, show_variable_missing_values
Package source and reference documentation · Complete workflow
Walkthrough: Read missingness in the packaged example
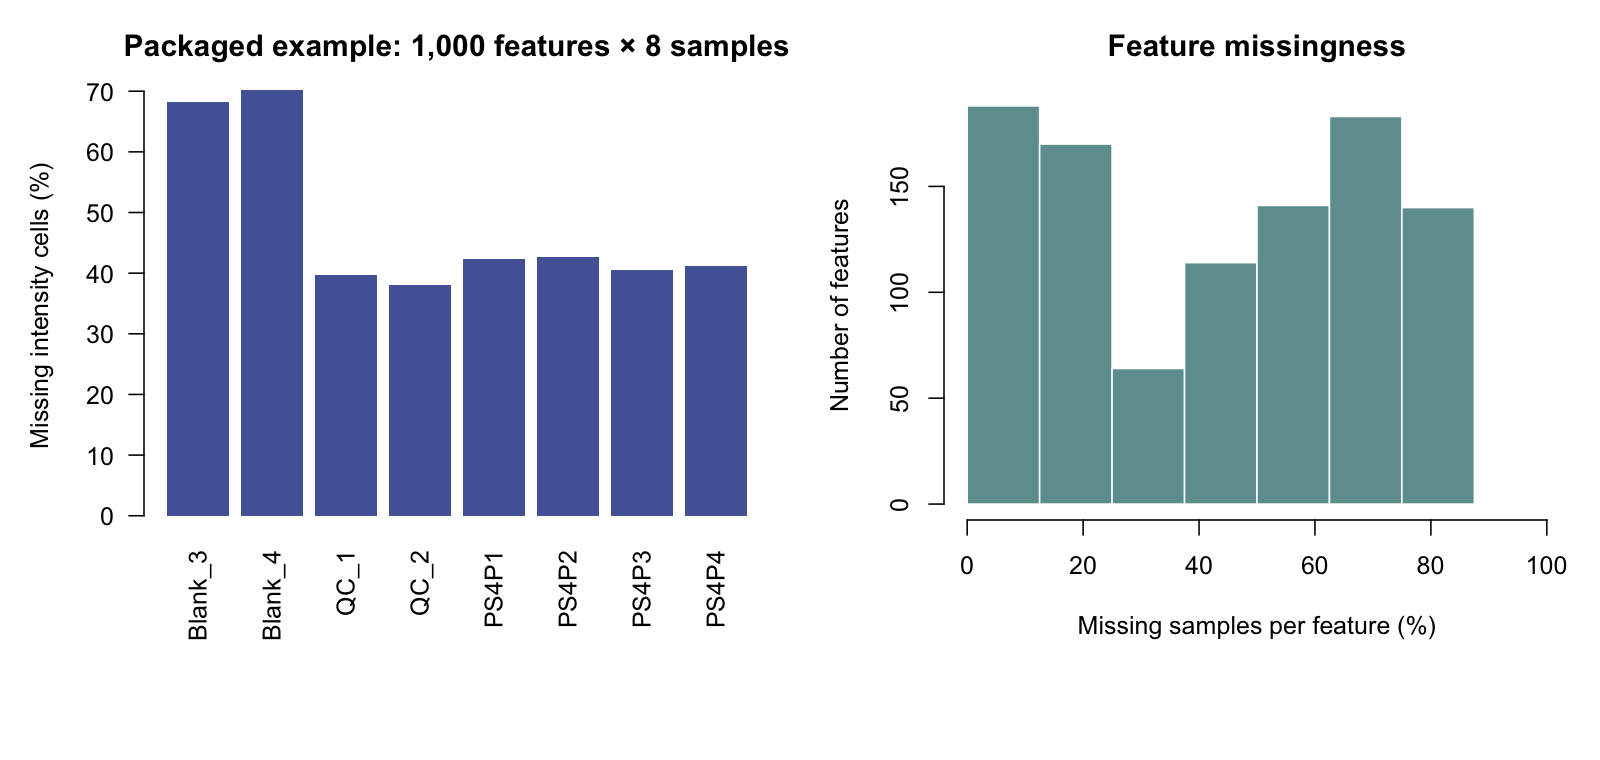
- The left bars show missing matrix cells per sample as a percentage of 1,000 features. Compare samples before deciding whether one is problematic.
- The right histogram summarizes feature-level missingness across eight samples. A feature missing in all samples contributes no quantitative evidence.
- Use these diagnostics to choose and document filtering rules. The plot itself does not prescribe a universal threshold.