Data preparation
Load the differential expressional metabolites.
library(tidymass)
#> Registered S3 method overwritten by 'Hmisc':
#>   method       from
#>   vcov.default fit.models
#> ── Attaching packages ──────────────────────────────────────── tidymass 1.0.9 ──
#> ✔ massdataset   1.0.34     ✔ metid         1.2.34
#> ✔ massprocesser 1.0.10     ✔ masstools     1.0.13
#> ✔ masscleaner   1.0.12     ✔ dplyr         1.1.4
#> ✔ massqc        1.0.7      ✔ ggplot2       3.5.1
#> ✔ massstat      1.0.6      ✔ magrittr      2.0.3
#> ✔ metpath       1.0.8
library(tidyverse)
#> ── Attaching core tidyverse packages ──────────────────────── tidyverse 2.0.0 ──
#> ✔ forcats   1.0.0     ✔ readr     2.1.5
#> ✔ lubridate 1.9.3     ✔ stringr   1.5.1
#> ✔ purrr     1.0.2     ✔ tibble    3.2.1
#> ── Conflicts ────────────────────────────────────────── tidyverse_conflicts() ──
#> ✖ xcms::collect()          masks dplyr::collect()
#> ✖ MSnbase::combine()       masks Biobase::combine(), BiocGenerics::combine(), dplyr::combine()
#> ✖ tidyr::expand()          masks S4Vectors::expand()
#> ✖ tidyr::extract()         masks magrittr::extract()
#> ✖ metid::filter()          masks metpath::filter(), dplyr::filter(), massdataset::filter(), stats::filter()
#> ✖ S4Vectors::first()       masks dplyr::first()
#> ✖ xcms::groups()           masks dplyr::groups()
#> ✖ dplyr::lag()             masks stats::lag()
#> ✖ purrr::map()             masks mixOmics::map()
#> ✖ BiocGenerics::Position() masks ggplot2::Position(), base::Position()
#> ✖ purrr::reduce()          masks MSnbase::reduce()
#> ✖ S4Vectors::rename()      masks dplyr::rename(), massdataset::rename()
#> ✖ lubridate::second()      masks S4Vectors::second()
#> ✖ lubridate::second<-()    masks S4Vectors::second<-()
#> ✖ MASS::select()           masks dplyr::select(), massdataset::select()
#> ✖ purrr::set_names()       masks magrittr::set_names()
#> ℹ Use the conflicted package (<http://conflicted.r-lib.org/>) to force all conflicts to become errors
load("statistical_analysis/object_final")
object_final
#> --------------------
#> massdataset version: 1.0.34
#> --------------------
#> 1.expression_data:[ 208 x 259 data.frame]
#> 2.sample_info:[ 259 x 11 data.frame]
#> 259 samples:sample_06 sample_103 sample_11 ... sample_QC_38 sample_QC_39
#> 3.variable_info:[ 208 x 12 data.frame]
#> 208 variables:M86T95_POS M95T100_1_POS M100T160_POS ... M478T658_NEG M480T641_NEG
#> 4.sample_info_note:[ 11 x 2 data.frame]
#> 5.variable_info_note:[ 12 x 2 data.frame]
#> 6.ms2_data:[ 2134 variables x 1939 MS2 spectra]
#> --------------------
#> Processing information
#> 24 processings in total
#> Latest 3 processings show
#> slice_head ----------
#>       Package Function.used                       Time
#> 1 massdataset  slice_head() 2024-09-25 20:59:42.450782
#> 2 massdataset  slice_head()  2024-09-25 20:59:42.62459
#> mutate_fc ----------
#>       Package Function.used                Time
#> 1 massdataset   mutate_fc() 2024-09-25 20:59:42
#> mutate_p_value ----------
#>       Package    Function.used                Time
#> 1 massdataset mutate_p_value() 2024-09-25 20:59:42
Pathway enrichment
All the results will be placed in a folder named as pathway_enrichment.
dir.create(path = "pathway_enrichment", showWarnings = FALSE)
diff_metabolites <-
  object_final %>%
  activate_mass_dataset(what = "variable_info") %>%
  filter(p_value_adjust < 0.05) %>%
  extract_variable_info()
head(diff_metabolites)
#>     variable_id        mz        rt    na_freq  na_freq.1  na_freq.2 na_freq_2
#> 1    M86T95_POS  86.09716  94.57264 0.02564103 0.55454545 0.29090909        NA
#> 2 M95T100_1_POS  95.04975  99.77637 0.00000000 0.00000000 0.00000000        NA
#> 3   M104T51_POS 104.10746  51.27993 0.00000000 0.07272727 0.00000000        NA
#> 4   M113T81_POS 113.03501  80.73506 0.00000000 0.00000000 0.00000000        NA
#> 5  M113T187_POS 113.06018 186.56470 0.02564103 0.01818182 0.02727273        NA
#> 6   M114T52_POS 114.06658  52.31072 0.00000000 0.00000000 0.00000000        NA
#>   na_freq.1_2 na_freq.2_2       fc      p_value p_value_adjust
#> 1          NA          NA 1.714629 3.034938e-20   4.912294e-19
#> 2          NA          NA 1.439791 6.761432e-31   3.515945e-29
#> 3          NA          NA 1.751085 2.695171e-08   1.334751e-07
#> 4          NA          NA 1.500756 5.966911e-22   1.241118e-20
#> 5          NA          NA 1.951417 1.848299e-17   2.023401e-16
#> 6          NA          NA 1.382309 9.673602e-05   3.095553e-04
#>          Compound.name    CAS.ID   HMDB.ID KEGG.ID     Lab.ID Adduct  mz.error
#> 1           Piperidine  110-89-4      <NA>  C01746  MONA_2852 (M+H)+ 1.7468691
#> 2               Phenol  108-95-2      <NA>  D01960 MONA_18506 (M+H)+ 1.4164283
#> 3   5-Amino-1-pentanol 2508-29-4      <NA>    <NA>    NO07238 (M+H)+ 1.1691284
#> 4               Uracil   66-22-8 HMDB00300  C00106    NO07292 (M+H)+ 1.2189636
#> 5 1,4-Cyclohexanedione      <NA>      <NA>    <NA> MONA_14519 (M+H)+ 1.0516262
#> 6           Creatinine   60-27-5 HMDB00562  C00791    NO07303 (M+H)+ 0.7404486
#>   mz.match.score RT.error RT.match.score                  CE        SS
#> 1      0.9932417       NA             NA                  30 0.6143541
#> 2      0.9955515       NA             NA                  10 0.6102452
#> 3      0.9969671       NA             NA                   5 0.5971697
#> 4      0.9967035       NA             NA                  10 0.6484578
#> 5      0.9975454       NA             NA HCD (NCE 20-30-40%) 0.5401414
#> 6      0.9987824       NA             NA                  20 0.6094410
#>   Total.score   Database Level
#> 1   0.6996930 MoNA_0.0.1     2
#> 2   0.6979976 MoNA_0.0.1     2
#> 3   0.6906242 NIST_0.0.1     2
#> 4   0.7213092 NIST_0.0.1     2
#> 5   0.6566000 MoNA_0.0.1     2
#> 6   0.6985921 NIST_0.0.1     2
Load KEGG human pathway database
data("kegg_hsa_pathway", package = "metpath")
kegg_hsa_pathway
#> ---------Pathway source&version---------
#> KEGG  &  2021-12-13
#> -----------Pathway information------------
#> 345  pathways
#> 334  pathways have genes
#> 0  pathways have proteins
#> 281  pathways have compounds
#> Pathway class (top 10): Metabolism; Carbohydrate metabolism;Metabolism; Lipid metabolism
get_pathway_class(kegg_hsa_pathway)
#> # A tibble: 43 × 2
#>    class                                                                       n
#>    <chr>                                                                   <int>
#>  1 Cellular Processes; Cell growth and death                                   8
#>  2 Cellular Processes; Cell motility                                           1
#>  3 Cellular Processes; Cellular community - eukaryotes                         5
#>  4 Cellular Processes; Transport and catabolism                                7
#>  5 Environmental Information Processing; Membrane transport                    1
#>  6 Environmental Information Processing; Signal transduction                  26
#>  7 Environmental Information Processing; Signaling molecules and interact…     5
#>  8 Genetic Information Processing; Folding, sorting and degradation            7
#>  9 Genetic Information Processing; Replication and repair                      7
#> 10 Genetic Information Processing; Transcription                               3
#> # ℹ 33 more rows
Remove the disease pathways:
#get the class of pathways
pathway_class =
  metpath::pathway_class(kegg_hsa_pathway)
head(pathway_class)
#> $hsa00010
#> [1] "Metabolism; Carbohydrate metabolism"
#>
#> $hsa00020
#> [1] "Metabolism; Carbohydrate metabolism"
#>
#> $hsa00030
#> [1] "Metabolism; Carbohydrate metabolism"
#>
#> $hsa00040
#> [1] "Metabolism; Carbohydrate metabolism"
#>
#> $hsa00051
#> [1] "Metabolism; Carbohydrate metabolism"
#>
#> $hsa00052
#> [1] "Metabolism; Carbohydrate metabolism"
remain_idx =
  pathway_class %>%
  unlist() %>%
  stringr::str_detect("Disease") %>%
  `!`() %>%
  which()

remain_idx
#>   [1]   1   2   3   4   5   6   7   8   9  10  11  12  13  14  15  16  17  18
#>  [19]  19  20  21  22  23  24  25  26  27  28  29  30  31  32  33  34  35  36
#>  [37]  37  38  39  40  41  42  43  44  45  46  47  48  49  50  51  52  53  54
#>  [55]  55  56  57  58  59  60  61  62  63  64  65  66  67  68  69  70  71  72
#>  [73]  73  74  75  76  77  78  79  80  81  82  83  84  85  90  91  92  93  94
#>  [91]  95  96  97  98  99 100 101 102 103 104 105 106 107 108 109 110 111 112
#> [109] 113 114 115 116 117 118 119 120 121 122 123 124 125 126 127 128 129 130
#> [127] 131 132 133 134 135 136 137 138 139 140 141 142 143 144 145 146 147 148
#> [145] 149 150 151 152 153 154 155 156 157 158 159 160 161 162 163 164 165 166
#> [163] 167 168 169 170 171 172 173 174 175 176 177 178 179 180 181 182 183 184
#> [181] 185 186 187 188 189 190 191 192 193 194 195 196 197 198 199 200 201 202
#> [199] 203 204 205 206 207 208 209 210 211 212 213 214 215 216 217 218 219 220
#> [217] 221 222 223 224 225 226 227 228 229 230 236 240 241 242 243 244 245 246
#> [235] 247 248 249 250 251 252 253 254
pathway_database =
  kegg_hsa_pathway[remain_idx]
pathway_database
#> ---------Pathway source&version---------
#> KEGG  &  2021-12-13
#> -----------Pathway information------------
#> 242  pathways
#> 235  pathways have genes
#> 0  pathways have proteins
#> 191  pathways have compounds
#> Pathway class (top 10): Metabolism; Carbohydrate metabolism;Metabolism; Lipid metabolism
kegg_id <-
  diff_metabolites$KEGG.ID
kegg_id <-
  kegg_id[!is.na(kegg_id)]
kegg_id
#>  [1] "C01746" "D01960" "C00106" "C00791" "C00906" "C00262" "C14790" "C02237"
#>  [9] "C00073" "C00637" "C16366" "C07481" "C17846" "C14214" "C01595" "C00410"
#> [17] "C00762" "C00735" "C17337" "C01921" "C04230" "C04230" "C06539" "C00186"
#> [25] "C01546" "C01732" "C02226" "C00064" "C06104" "C07599" "0"      "C01601"
#> [33] "C00366" "C08322" "C16308" "C00294" "C03343" "C10911" "C05498" "C05472"
#> [41] "C04555"
result <-
enrich_kegg(query_id = kegg_id,
            query_type = "compound",
            id_type = "KEGG",
            pathway_database = pathway_database,
            p_cutoff = 0.05,
            p_adjust_method = "BH",
            threads = 3)
#> 191 pathways.
Check the result:
result
#> ---------Pathway database&version---------
#> KEGG  &  1.0.8
#> -----------Enrichment result------------
#> 191  pathways are enriched
#> 8  pathways p-values < 0.05
#> Steroid hormone biosynthesis
#> Aldosterone-regulated sodium reabsorption
#> Cushing syndrome
#> Purine metabolism
#> Caffeine metabolism ... (only top 5 shows)
#> -----------Parameters------------
#>   Package Function.used                Time
#> 1 metpath enrich_kegg() 2024-09-25 21:00:21
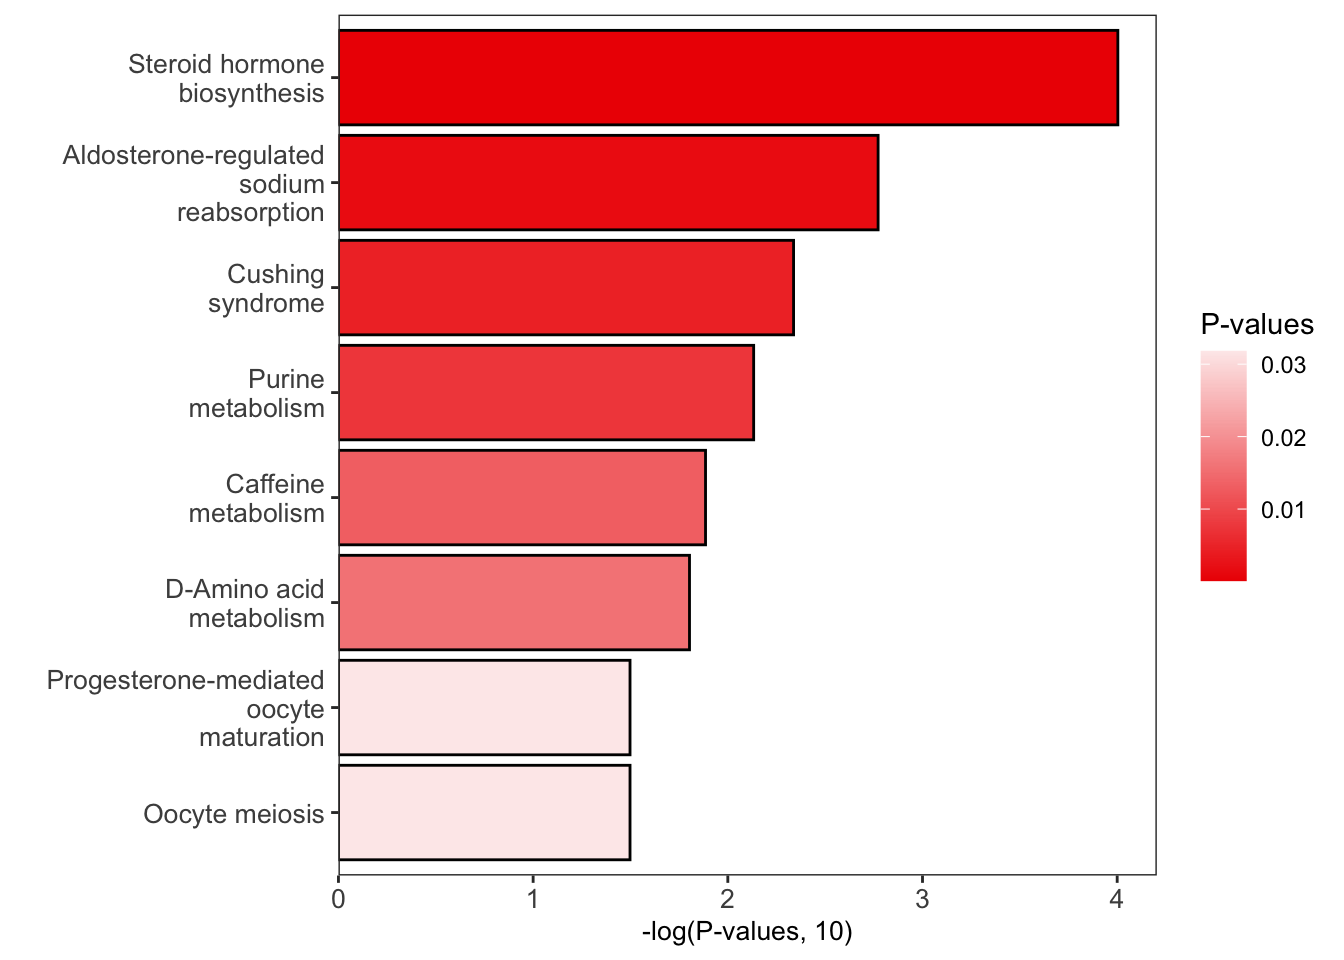
Plot to show pathway enrichment result
enrich_bar_plot(object = result,
                x_axis = "p_value",
                cutoff = 0.05)
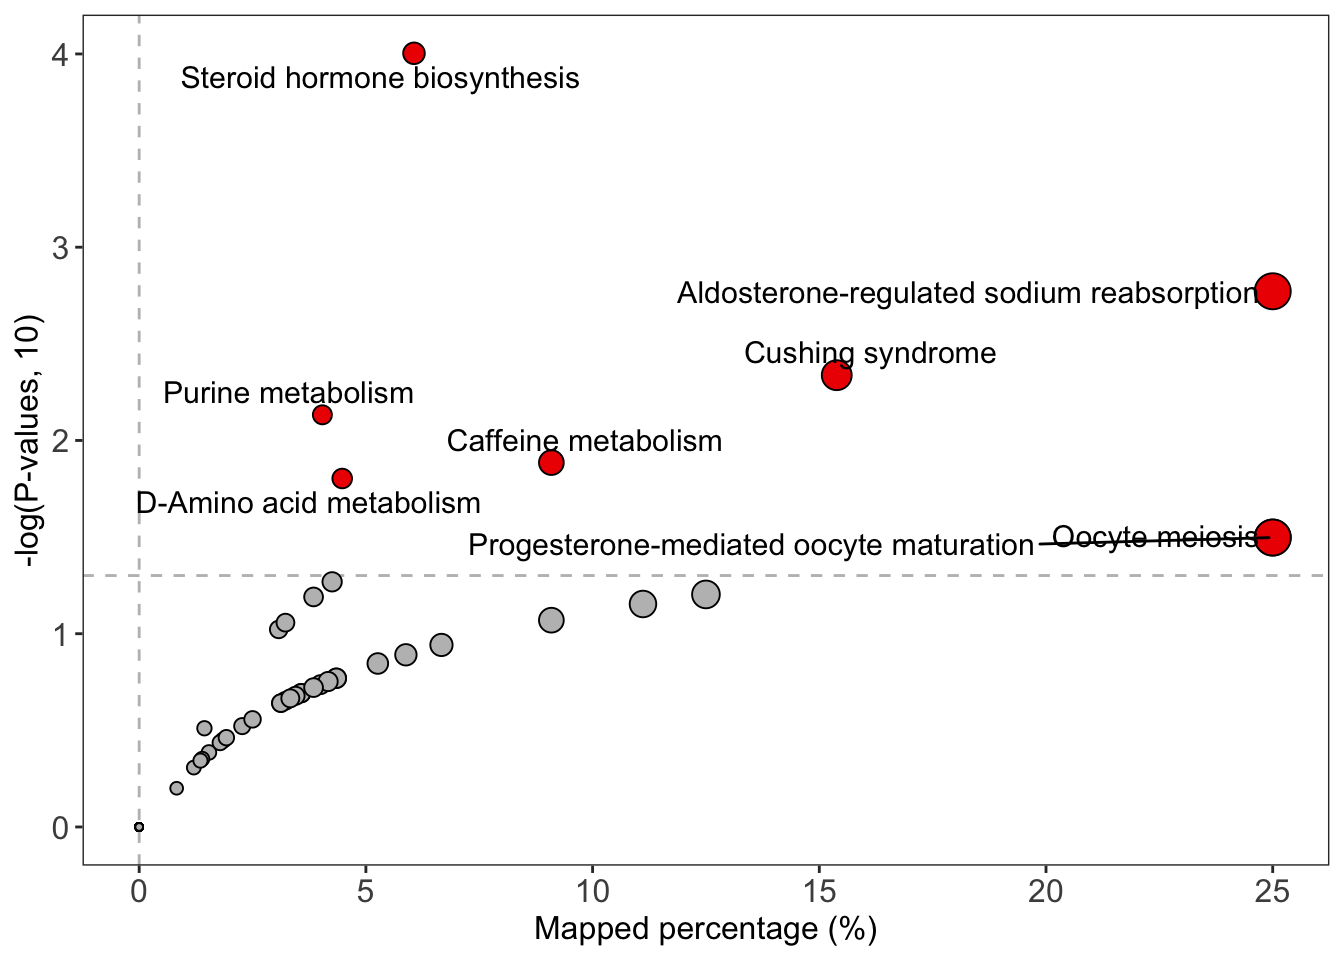
enrich_scatter_plot(object = result, y_axis = "p_value", y_axis_cutoff = 0.05)
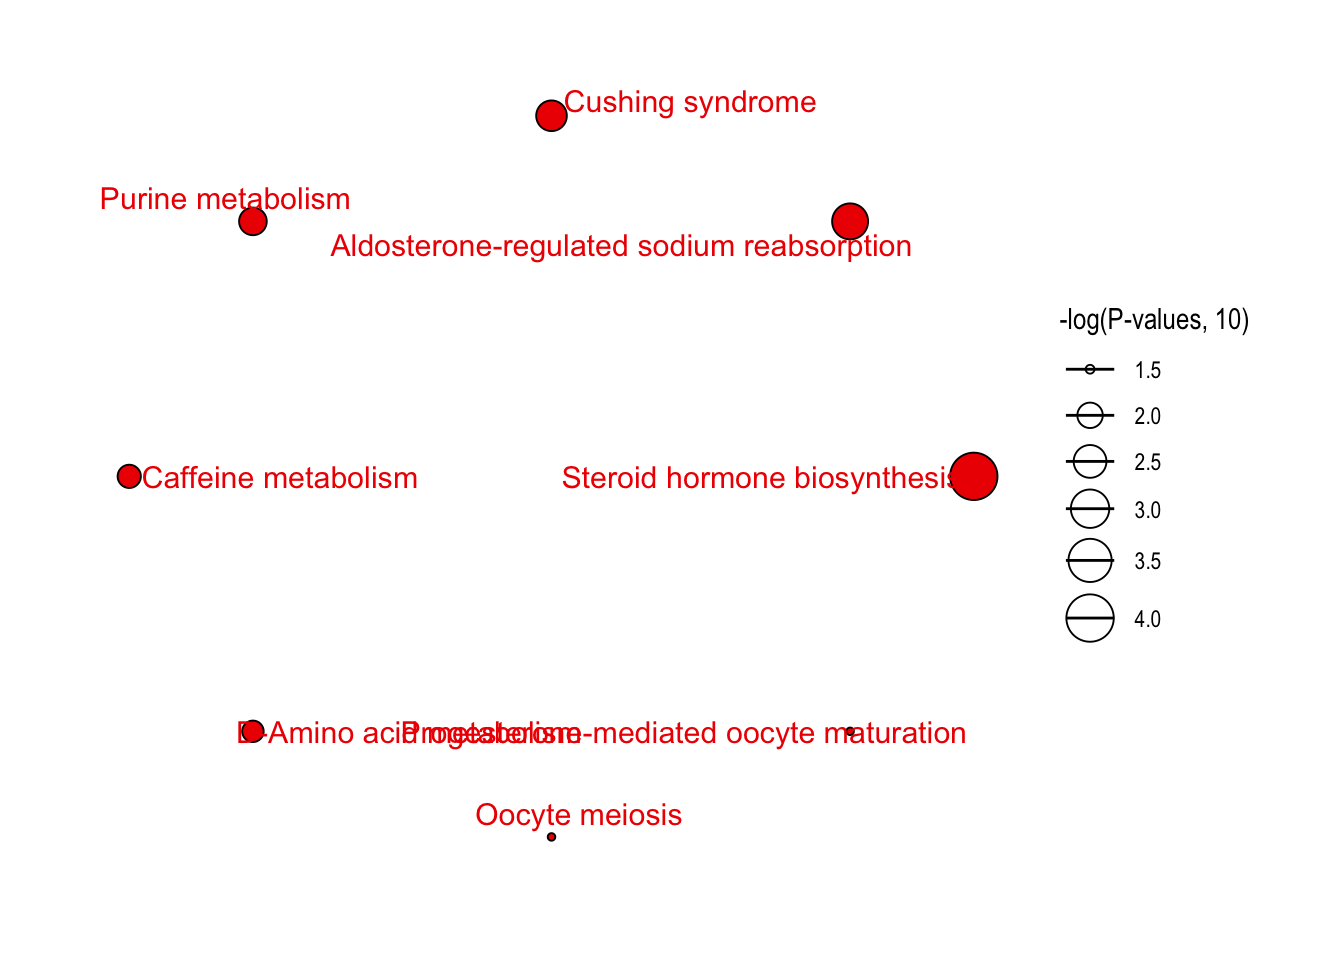
enrich_network(
  object = result,
  point_size = "p_value",
  p_cutoff = 0.05,
  only_significant_pathway = TRUE
)
Session information
sessionInfo()
#> R version 4.4.1 (2024-06-14)
#> Platform: aarch64-apple-darwin20
#> Running under: macOS 15.0
#>
#> Matrix products: default
#> BLAS:   /Library/Frameworks/R.framework/Versions/4.4-arm64/Resources/lib/libRblas.0.dylib
#> LAPACK: /Library/Frameworks/R.framework/Versions/4.4-arm64/Resources/lib/libRlapack.dylib;  LAPACK version 3.12.0
#>
#> locale:
#> [1] en_US.UTF-8/en_US.UTF-8/en_US.UTF-8/C/en_US.UTF-8/en_US.UTF-8
#>
#> time zone: Asia/Singapore
#> tzcode source: internal
#>
#> attached base packages:
#> [1] grid      stats4    stats     graphics  grDevices utils     datasets
#> [8] methods   base
#>
#> other attached packages:
#>  [1] lubridate_1.9.3       forcats_1.0.0         stringr_1.5.1
#>  [4] purrr_1.0.2           readr_2.1.5           tibble_3.2.1
#>  [7] tidyverse_2.0.0       metid_1.2.34          metpath_1.0.8
#> [10] ComplexHeatmap_2.20.0 mixOmics_6.28.0       lattice_0.22-6
#> [13] MASS_7.3-61           massstat_1.0.6        tidyr_1.3.1
#> [16] ggfortify_0.4.17      massqc_1.0.7          masscleaner_1.0.12
#> [19] MSnbase_2.30.1        ProtGenerics_1.36.0   S4Vectors_0.42.1
#> [22] Biobase_2.64.0        BiocGenerics_0.50.0   mzR_2.38.0
#> [25] Rcpp_1.0.13           xcms_4.2.3            BiocParallel_1.38.0
#> [28] massprocesser_1.0.10  ggplot2_3.5.1         dplyr_1.1.4
#> [31] magrittr_2.0.3        masstools_1.0.13      massdataset_1.0.34
#> [34] tidymass_1.0.9
#>
#> loaded via a namespace (and not attached):
#>   [1] fs_1.6.4                    matrixStats_1.3.0
#>   [3] bitops_1.0-8                fit.models_0.64
#>   [5] httr_1.4.7                  RColorBrewer_1.1-3
#>   [7] doParallel_1.0.17           tools_4.4.1
#>   [9] doRNG_1.8.6                 backports_1.5.0
#>  [11] utf8_1.2.4                  R6_2.5.1
#>  [13] lazyeval_0.2.2              GetoptLong_1.0.5
#>  [15] withr_3.0.1                 prettyunits_1.2.0
#>  [17] gridExtra_2.3               preprocessCore_1.66.0
#>  [19] cli_3.6.3                   fastDummies_1.7.4
#>  [21] labeling_0.4.3              sass_0.4.9
#>  [23] mvtnorm_1.3-1               robustbase_0.99-4
#>  [25] randomForest_4.7-1.1        proxy_0.4-27
#>  [27] pbapply_1.7-2               foreign_0.8-87
#>  [29] rrcov_1.7-6                 MetaboCoreUtils_1.12.0
#>  [31] parallelly_1.38.0           itertools_0.1-3
#>  [33] limma_3.60.4                readxl_1.4.3
#>  [35] rstudioapi_0.16.0           impute_1.78.0
#>  [37] generics_0.1.3              shape_1.4.6.1
#>  [39] zip_2.3.1                   Matrix_1.7-0
#>  [41] MALDIquant_1.22.3           fansi_1.0.6
#>  [43] abind_1.4-5                 lifecycle_1.0.4
#>  [45] yaml_2.3.10                 SummarizedExperiment_1.34.0
#>  [47] SparseArray_1.4.8           crayon_1.5.3
#>  [49] PSMatch_1.8.0               KEGGREST_1.44.1
#>  [51] pillar_1.9.0                knitr_1.48
#>  [53] GenomicRanges_1.56.1        rjson_0.2.22
#>  [55] corpcor_1.6.10              codetools_0.2-20
#>  [57] glue_1.7.0                  pcaMethods_1.96.0
#>  [59] data.table_1.16.0           remotes_2.5.0
#>  [61] MultiAssayExperiment_1.30.3 vctrs_0.6.5
#>  [63] png_0.1-8                   cellranger_1.1.0
#>  [65] gtable_0.3.5                cachem_1.1.0
#>  [67] xfun_0.47                   openxlsx_4.2.7
#>  [69] S4Arrays_1.4.1              tidygraph_1.3.1
#>  [71] pcaPP_2.0-5                 ncdf4_1.23
#>  [73] iterators_1.0.14            statmod_1.5.0
#>  [75] robust_0.7-5                progress_1.2.3
#>  [77] GenomeInfoDb_1.40.1         rprojroot_2.0.4
#>  [79] bslib_0.8.0                 affyio_1.74.0
#>  [81] rpart_4.1.23                colorspace_2.1-1
#>  [83] DBI_1.2.3                   Hmisc_5.1-3
#>  [85] nnet_7.3-19                 tidyselect_1.2.1
#>  [87] compiler_4.4.1              MassSpecWavelet_1.70.0
#>  [89] htmlTable_2.4.3             DelayedArray_0.30.1
#>  [91] plotly_4.10.4               bookdown_0.40
#>  [93] checkmate_2.3.2             scales_1.3.0
#>  [95] DEoptimR_1.1-3              affy_1.82.0
#>  [97] digest_0.6.37               rmarkdown_2.28
#>  [99] XVector_0.44.0              htmltools_0.5.8.1
#> [101] pkgconfig_2.0.3             base64enc_0.1-3
#> [103] MatrixGenerics_1.16.0       highr_0.11
#> [105] fastmap_1.2.0               rlang_1.1.4
#> [107] GlobalOptions_0.1.2         htmlwidgets_1.6.4
#> [109] UCSC.utils_1.0.0            farver_2.1.2
#> [111] jquerylib_0.1.4             jsonlite_1.8.8
#> [113] MsExperiment_1.6.0          mzID_1.42.0
#> [115] RCurl_1.98-1.16             Formula_1.2-5
#> [117] GenomeInfoDbData_1.2.12     patchwork_1.2.0
#> [119] munsell_0.5.1               viridis_0.6.5
#> [121] MsCoreUtils_1.16.1          vsn_3.72.0
#> [123] furrr_0.3.1                 stringi_1.8.4
#> [125] ggraph_2.2.1                zlibbioc_1.50.0
#> [127] plyr_1.8.9                  parallel_4.4.1
#> [129] listenv_0.9.1               ggrepel_0.9.5
#> [131] Biostrings_2.72.1           MsFeatures_1.12.0
#> [133] graphlayouts_1.1.1          hms_1.1.3
#> [135] Spectra_1.14.1              circlize_0.4.16
#> [137] igraph_2.0.3                QFeatures_1.14.2
#> [139] rngtools_1.5.2              reshape2_1.4.4
#> [141] XML_3.99-0.17               evaluate_0.24.0
#> [143] blogdown_1.19               BiocManager_1.30.25
#> [145] tzdb_0.4.0                  foreach_1.5.2
#> [147] missForest_1.5              tweenr_2.0.3
#> [149] polyclip_1.10-7             future_1.34.0
#> [151] clue_0.3-65                 ggforce_0.4.2
#> [153] AnnotationFilter_1.28.0     e1071_1.7-14
#> [155] RSpectra_0.16-2             ggcorrplot_0.1.4.1
#> [157] viridisLite_0.4.2           class_7.3-22
#> [159] rARPACK_0.11-0              memoise_2.0.1
#> [161] ellipse_0.5.0               IRanges_2.38.1
#> [163] cluster_2.1.6               timechange_0.3.0
#> [165] globals_0.16.3              here_1.0.1