Based on the current published tutorial and the public tidymassshiny 1.0.0 source; checked September 23, 2026.
Initialize a project
Choose a working directory, upload sample_info.csv, map its columns when necessary, then click Initialize Project. Inspect the resulting sample information. IDs must match the intensity columns or raw filenames exactly; distinguish biological group, sample class, batch and acquisition order.
sample_id,group,class,injection.order,batch
S001,Control,Subject,1,B1
S002,Treatment,Subject,2,B1
QC001,QC,QC,3,B1
This is a format example, not sufficient replication for an experiment. Keep positive and negative measurements distinguishable and preserve leading zeros in IDs.
Start with MS files
Convert vendor files to suitable mzML/mzXML first. Vendor reader availability depends on the converter and platform. Organize MS1 files into the documented sample-type folders, such as QC and Subject.
Open Data import → Start with MS file, choose SELECT MS1 FOLDER, and click CHECK INPUT FILE. Review ppm, peakwidth, snthresh, noise and threads. A parameter optimization option is an aid; inspect resulting EICs and alignment to judge suitability. Start peak picking once inputs and parameters are correct, and wait for completion without launching the same operation repeatedly.
For the hosted version, use its upload workflow, package MS files as the required ZIP, then Process MS1 Files to unpack/process the upload. A local-directory picker is not a substitute for uploading to a remote server.
Start with a peak table
Open Start with table file and choose the CSV. The current source allows mapping the feature ID, m/z, RT and ion columns; the initial mapping uses the first four columns. A compatible template is:
variable_id,mz,rt,ion,S001,S002,QC001
F001,100.1234,60,pos,1000,1200,1100
F002,200.2345,120,neg,500,600,550
Use pos/neg or the supported polarity labels. Set Retention time in correctly: minutes are converted to seconds. Map the four metadata columns explicitly if your names/order differ. Keep all remaining columns as numeric sample intensities and ensure they match the initialized sample sheet.
Click Input file summary and check matching, polarity, sample counts and feature counts before Generate massdataset object. Inspect the separate positive/negative outputs. An extra text annotation column can be mistaken for intensity input, so remove or import it through the appropriate annotation route.
Start with an existing object
Choose Start with mass_dataset file, load the positive and negative objects into their respective controls, and use Check input. A CSV is not an R object merely because its extension is changed. Keep the original object and its package-version record.
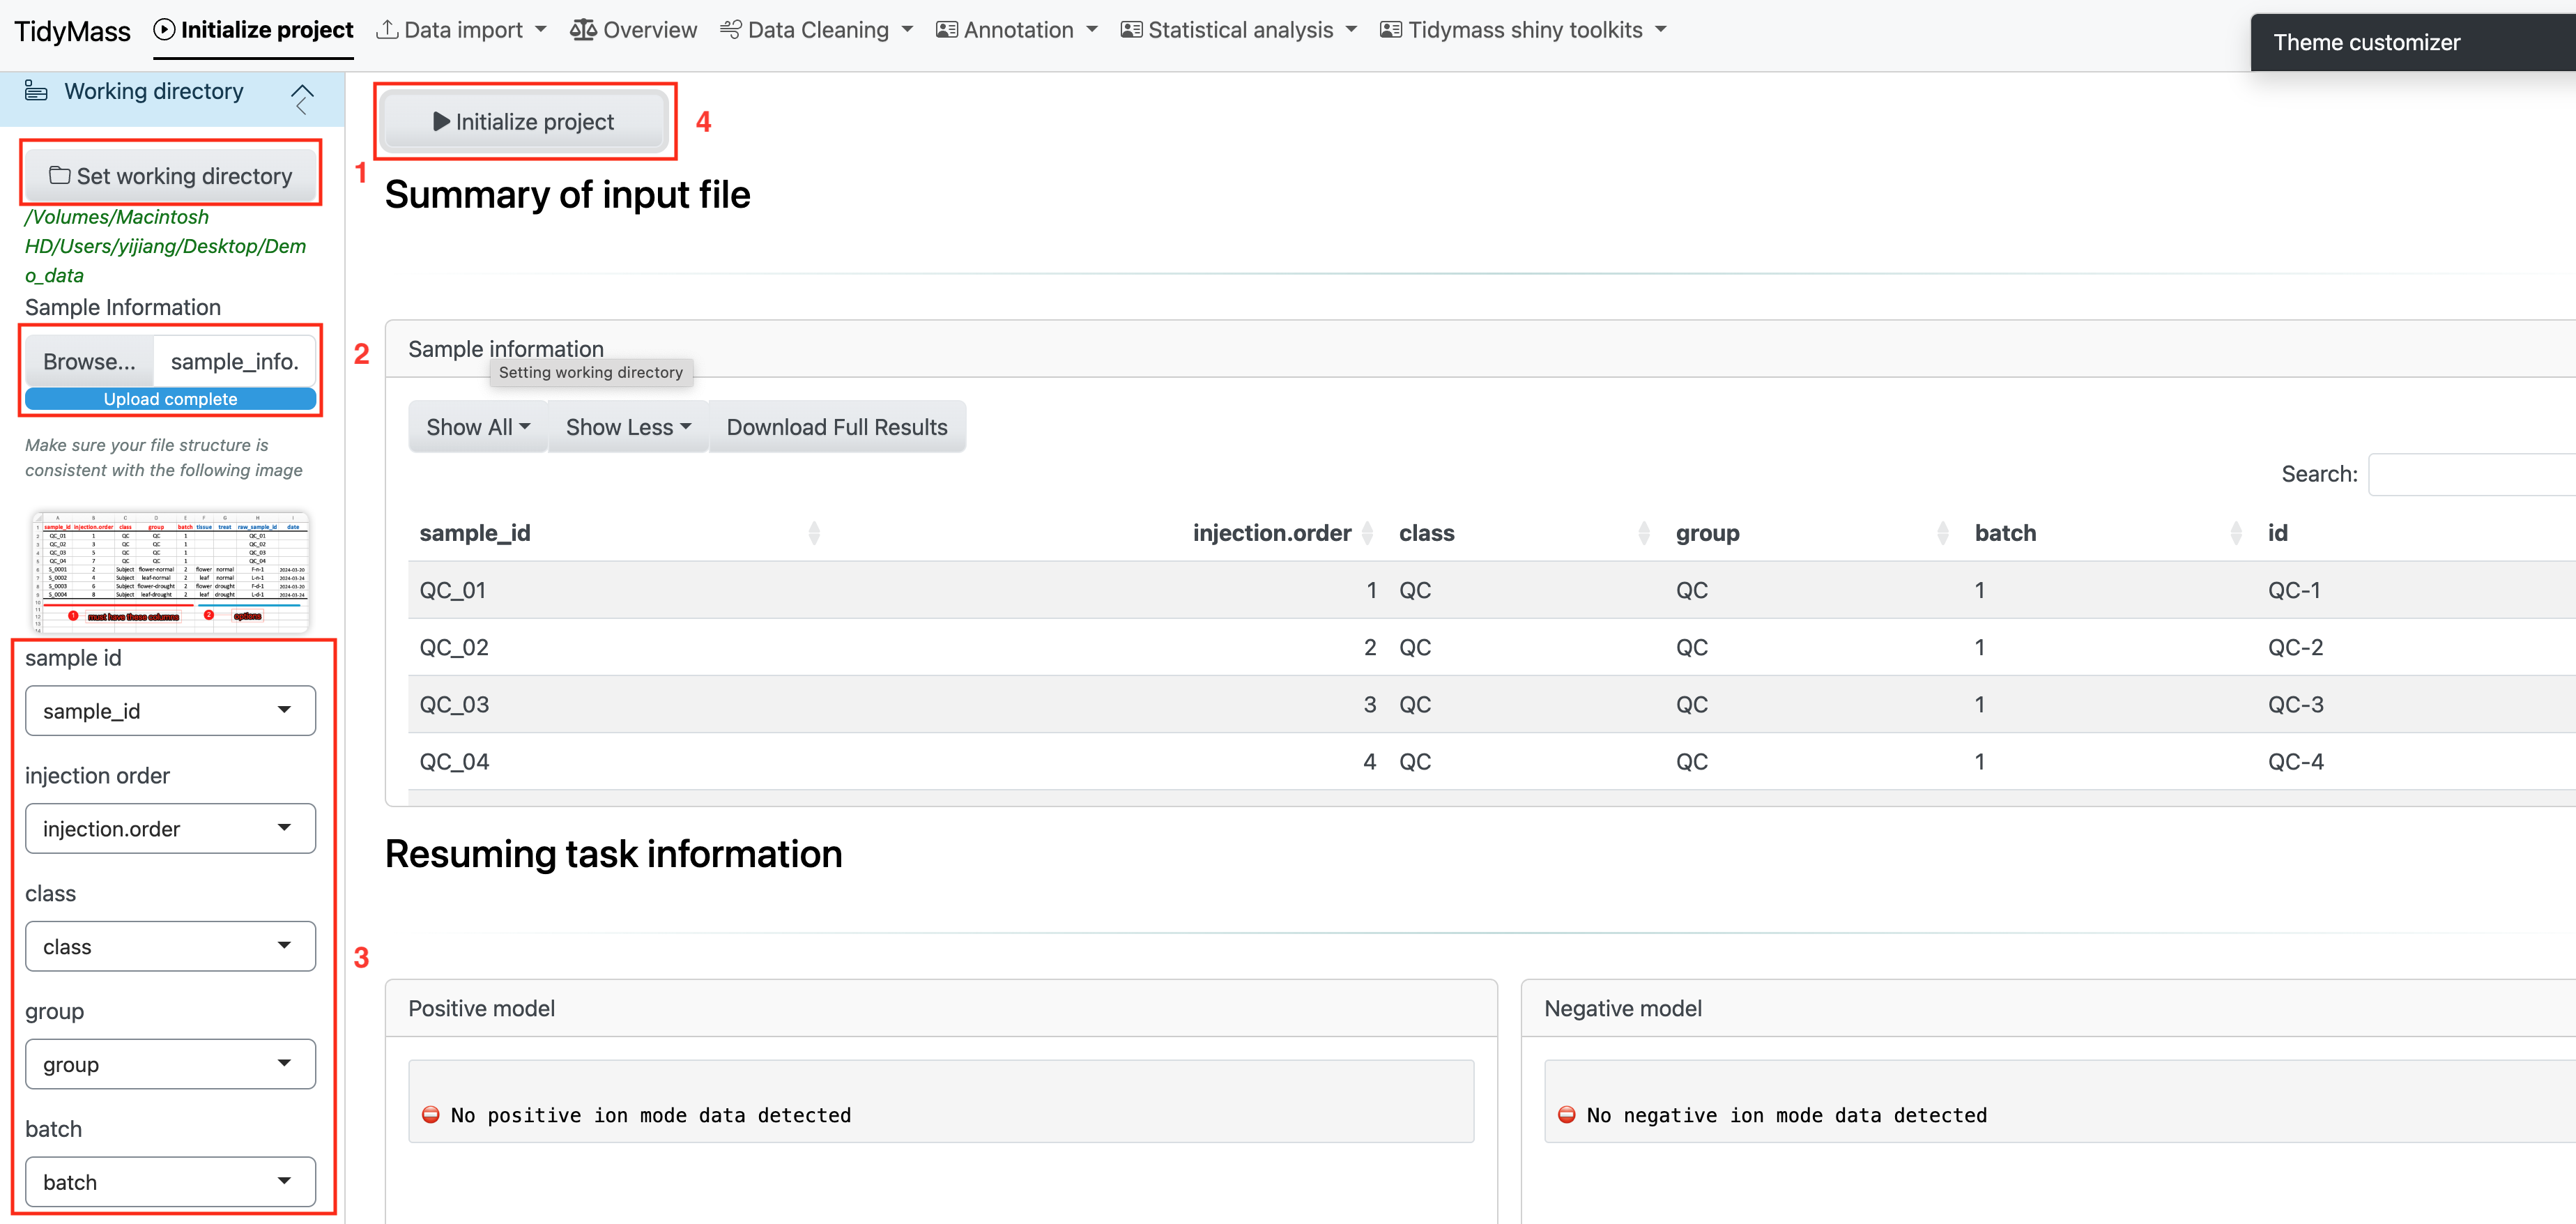
The screenshot is from the existing published Shiny tutorial; minor visual details can differ across deployments.