Based on the current published tutorial and the public tidymassshiny 1.0.0 source; checked September 23, 2026.
Attach experimental MS2
Choose Select MS2 folder and the prepared MGF files, separated by polarity. Set chromatography and precursor m/z/RT association tolerances, then click Start. Association tolerance links a spectrum to a feature; it is distinct from matching to a reference library.
Annotate metabolites
Place compatible reference databases in a dedicated directory and select Choose folder. Set MS1/MS2 tolerances, RT tolerance, candidate count, column and threads, then click Start annotation once. Watch the logs and wait for the task to finish.
MoNA, MassBank and HMDB are public resources, not automatically in-house standards. Use reference RT only for comparable chromatography. Inspect candidates and available spectral evidence before accepting a name. Software confidence labels require interpretation in light of the actual measurements; an MS1-only candidate does not become a confirmed structure by receiving a level label.
Filter annotations and inspect origins
Choose how to retain multiple candidates, handle redundant adducts and filter supported evidence levels. Use Adduct for level 3 annotation where appropriate and run START. Preserve the unfiltered candidates and the rule used to reduce them.
In Metabolites origin, use Check database, then Start. An UpSet view summarizes origin associations and intersections. Select a compound and Show network plot for its database relationships. These are reference associations, not demonstrated biosynthetic origins in your sample.
Differential analysis
Use Wake up object, choose the sample attribute and explicitly select the control/reference group. Run the comparison, then inspect PCA and volcano plots. Confirm fold-change direction and distinguish a raw P-value cutoff from FDR/adjusted P-value. Retain the full table, including nonsignificant features.
Use only the biological samples intended for the test. Do not infer pairing from row order. If the module cannot represent the study’s repeated measures or covariates, export the object and use the appropriate R model.
Pathway enrichment
Choose KEGG/HMDB or Upload custom database, verify the organism and ID system, and set the adjustment method, cutoff and threads. Inspect the bar/scatter plots and mapping coverage. Review candidate ambiguity, collapse redundant compound IDs and record the background used by the method. Enrichment is a statistical association with a reference set, not direct proof of pathway activation.
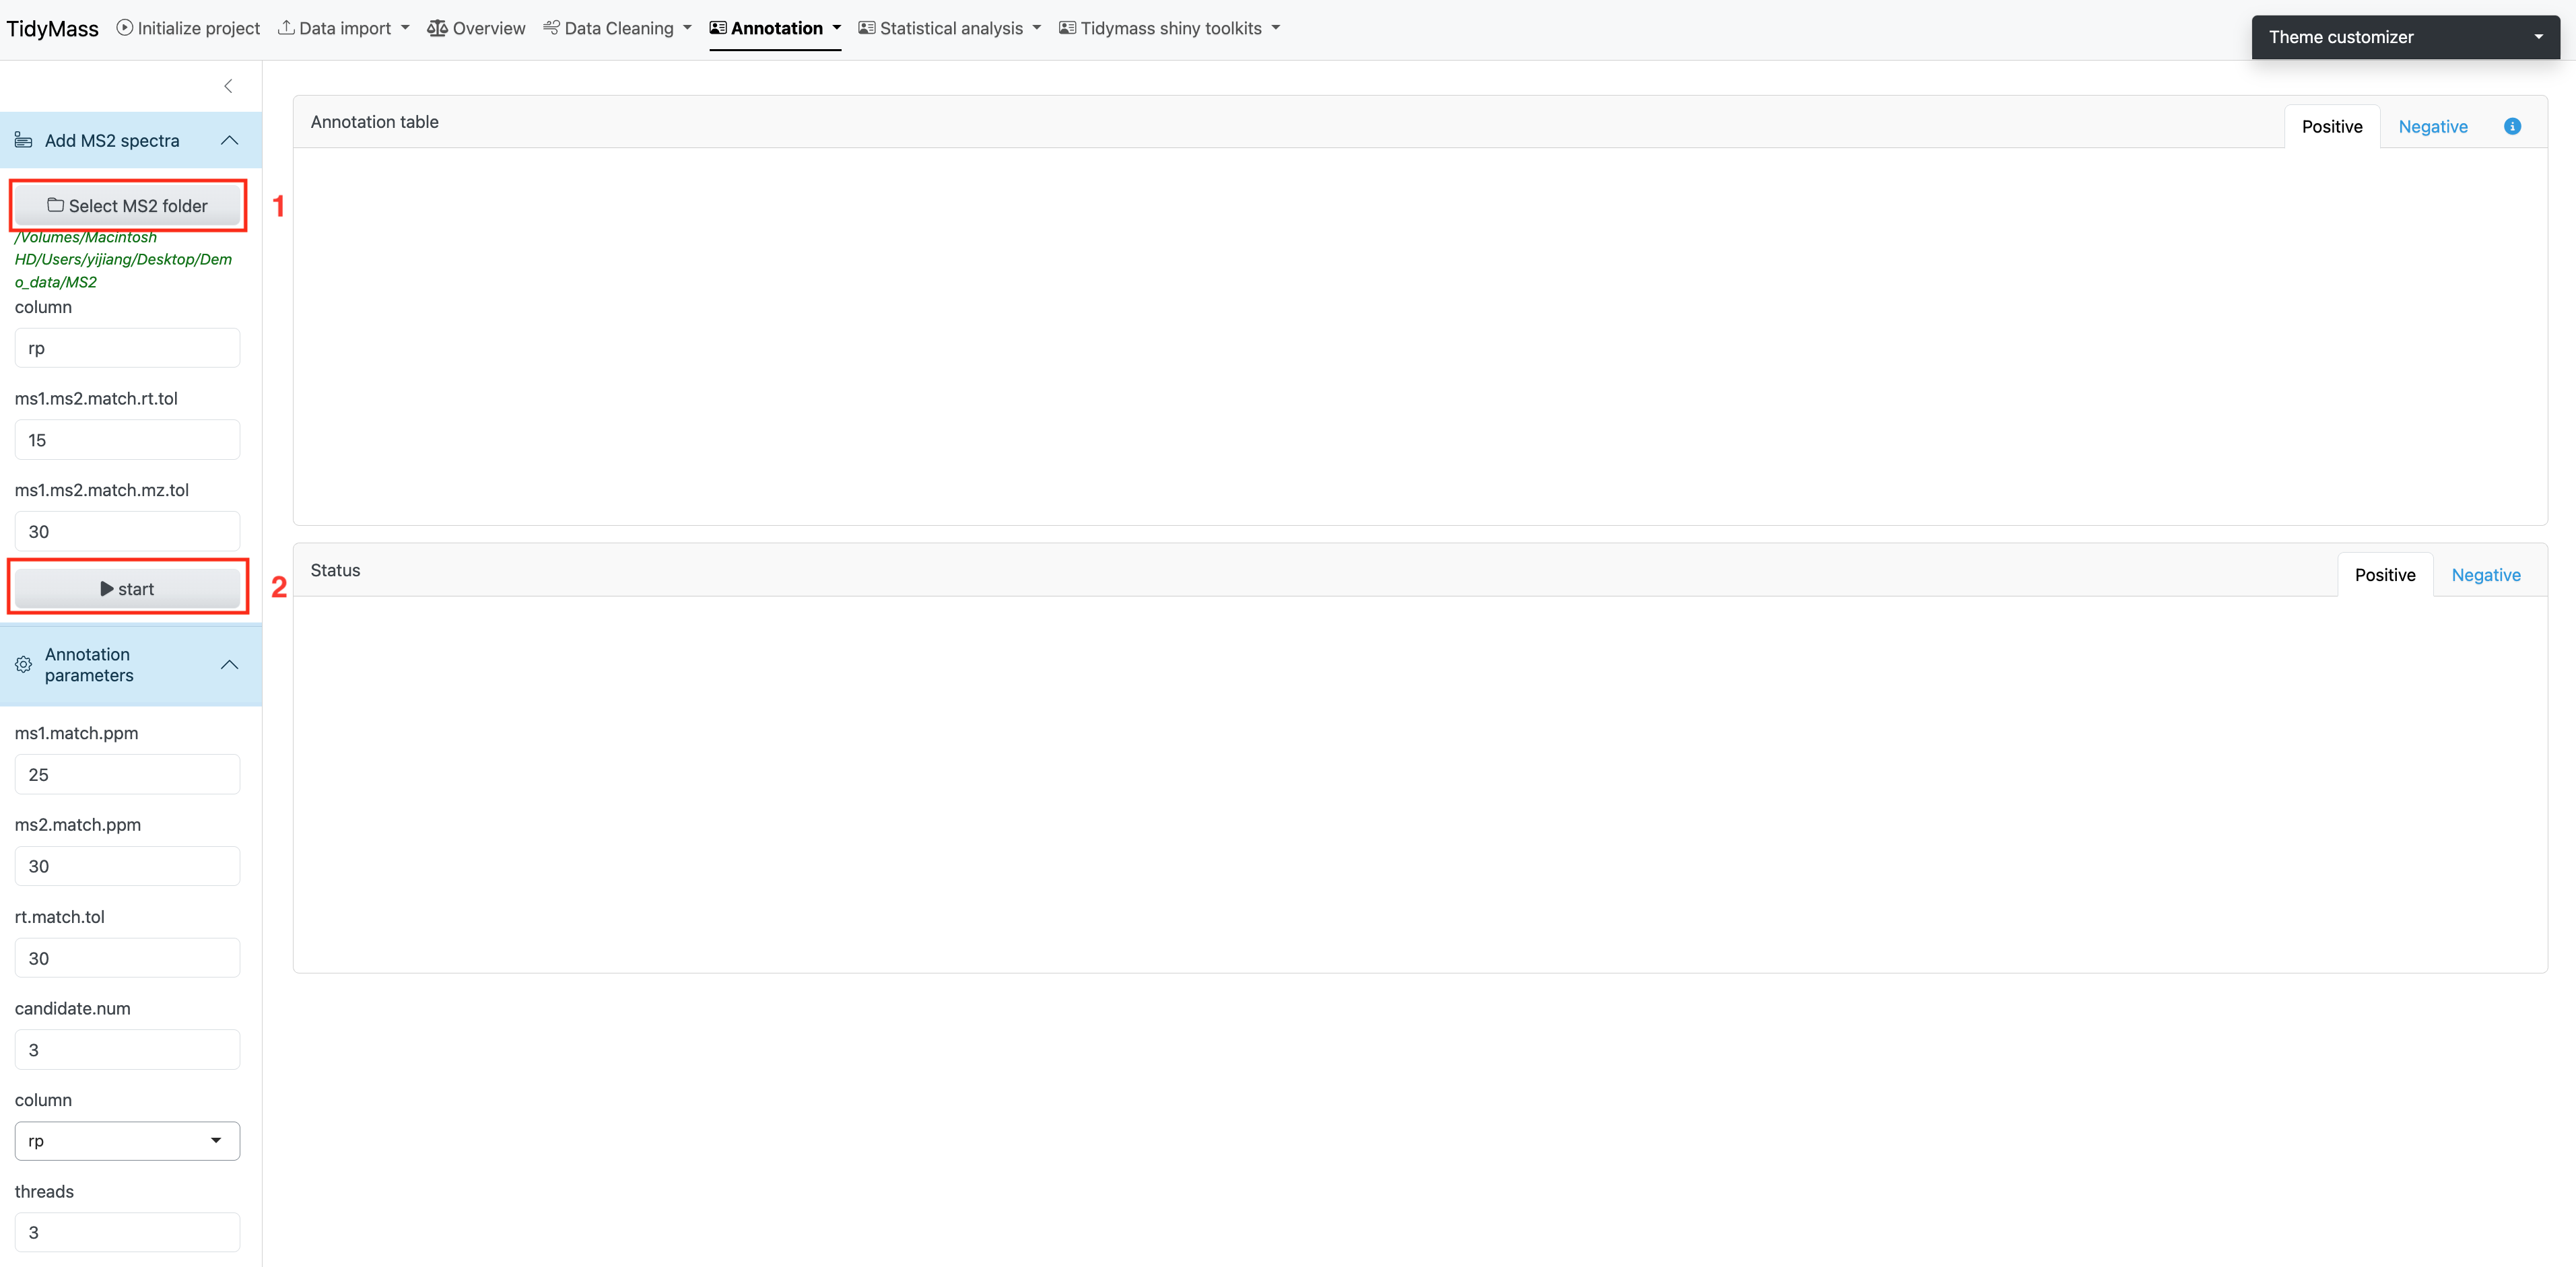
Screenshot from the existing published tutorial.