Data import and export
Xiaotao Shen
Created on 2021-12-04 and updated on 2026-03-04
Source:vignettes/data_import_and_export.Rmd
data_import_and_export.RmdData preparation
The massdataset class object can be used to store the
untargeted metabolomics data.
Let’s first prepare the data objects according to the attached figure for each file.
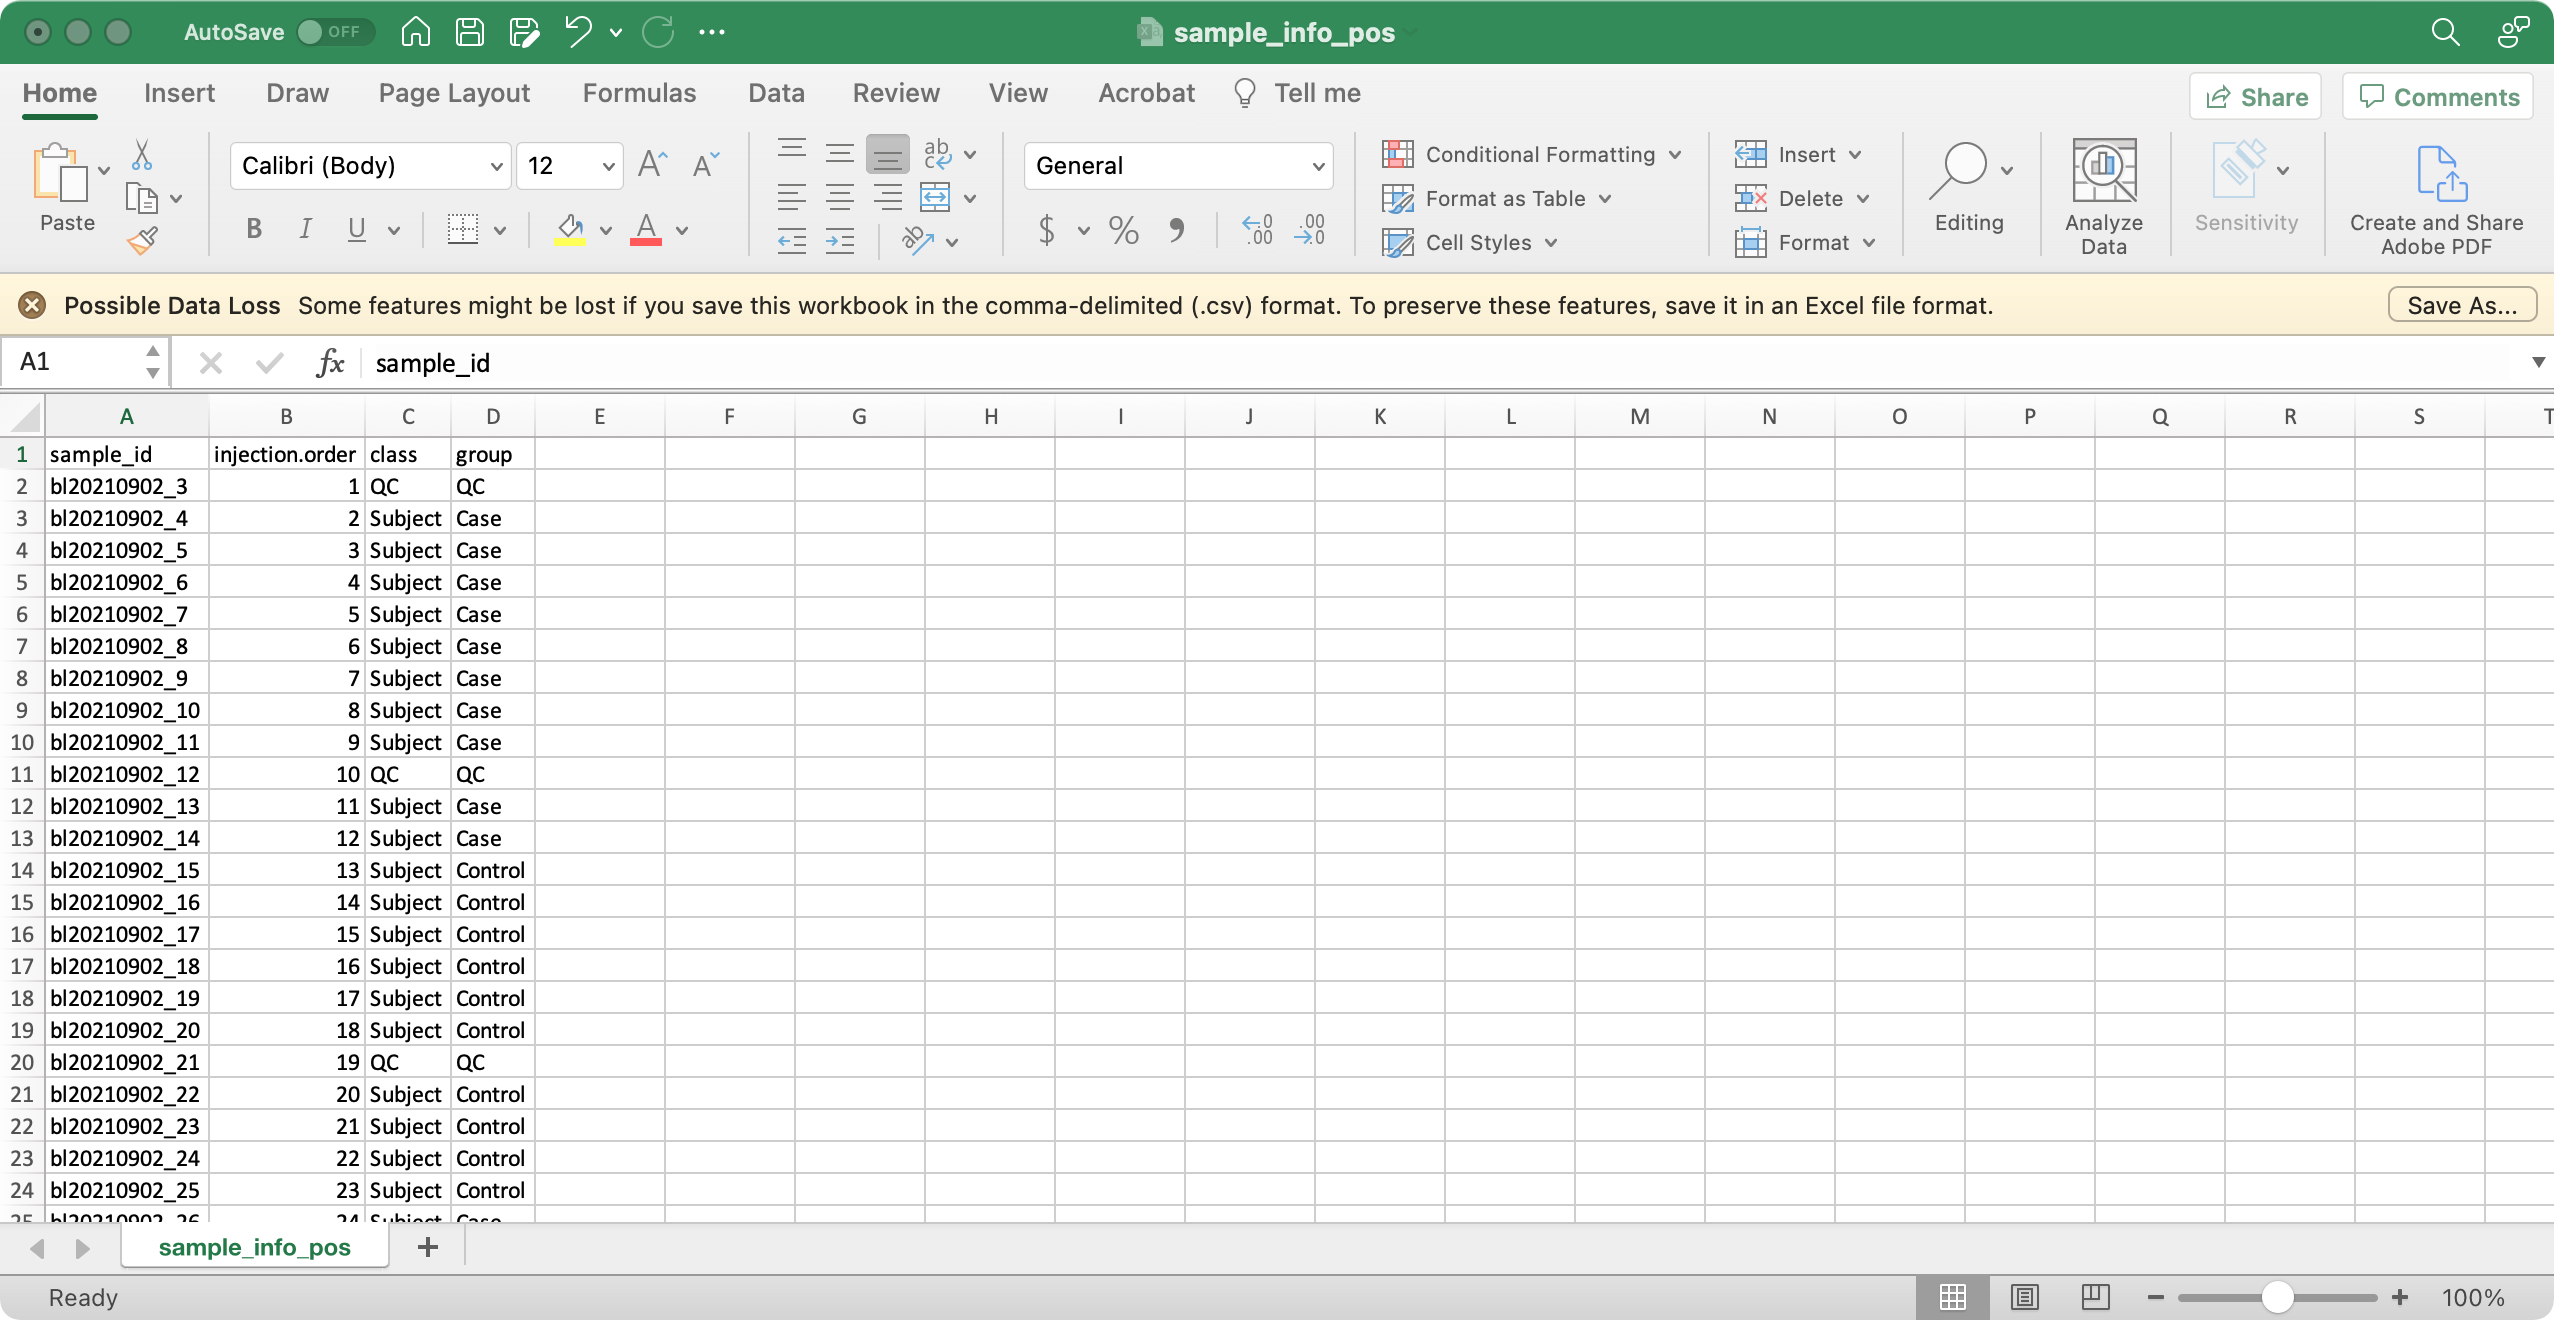
1. sample_info (required)
The columns sample_id (sample ID),
injection.order (injection order of samples),
class (Blank, QC, Subject, etc), group (case,
control, etc) are required.
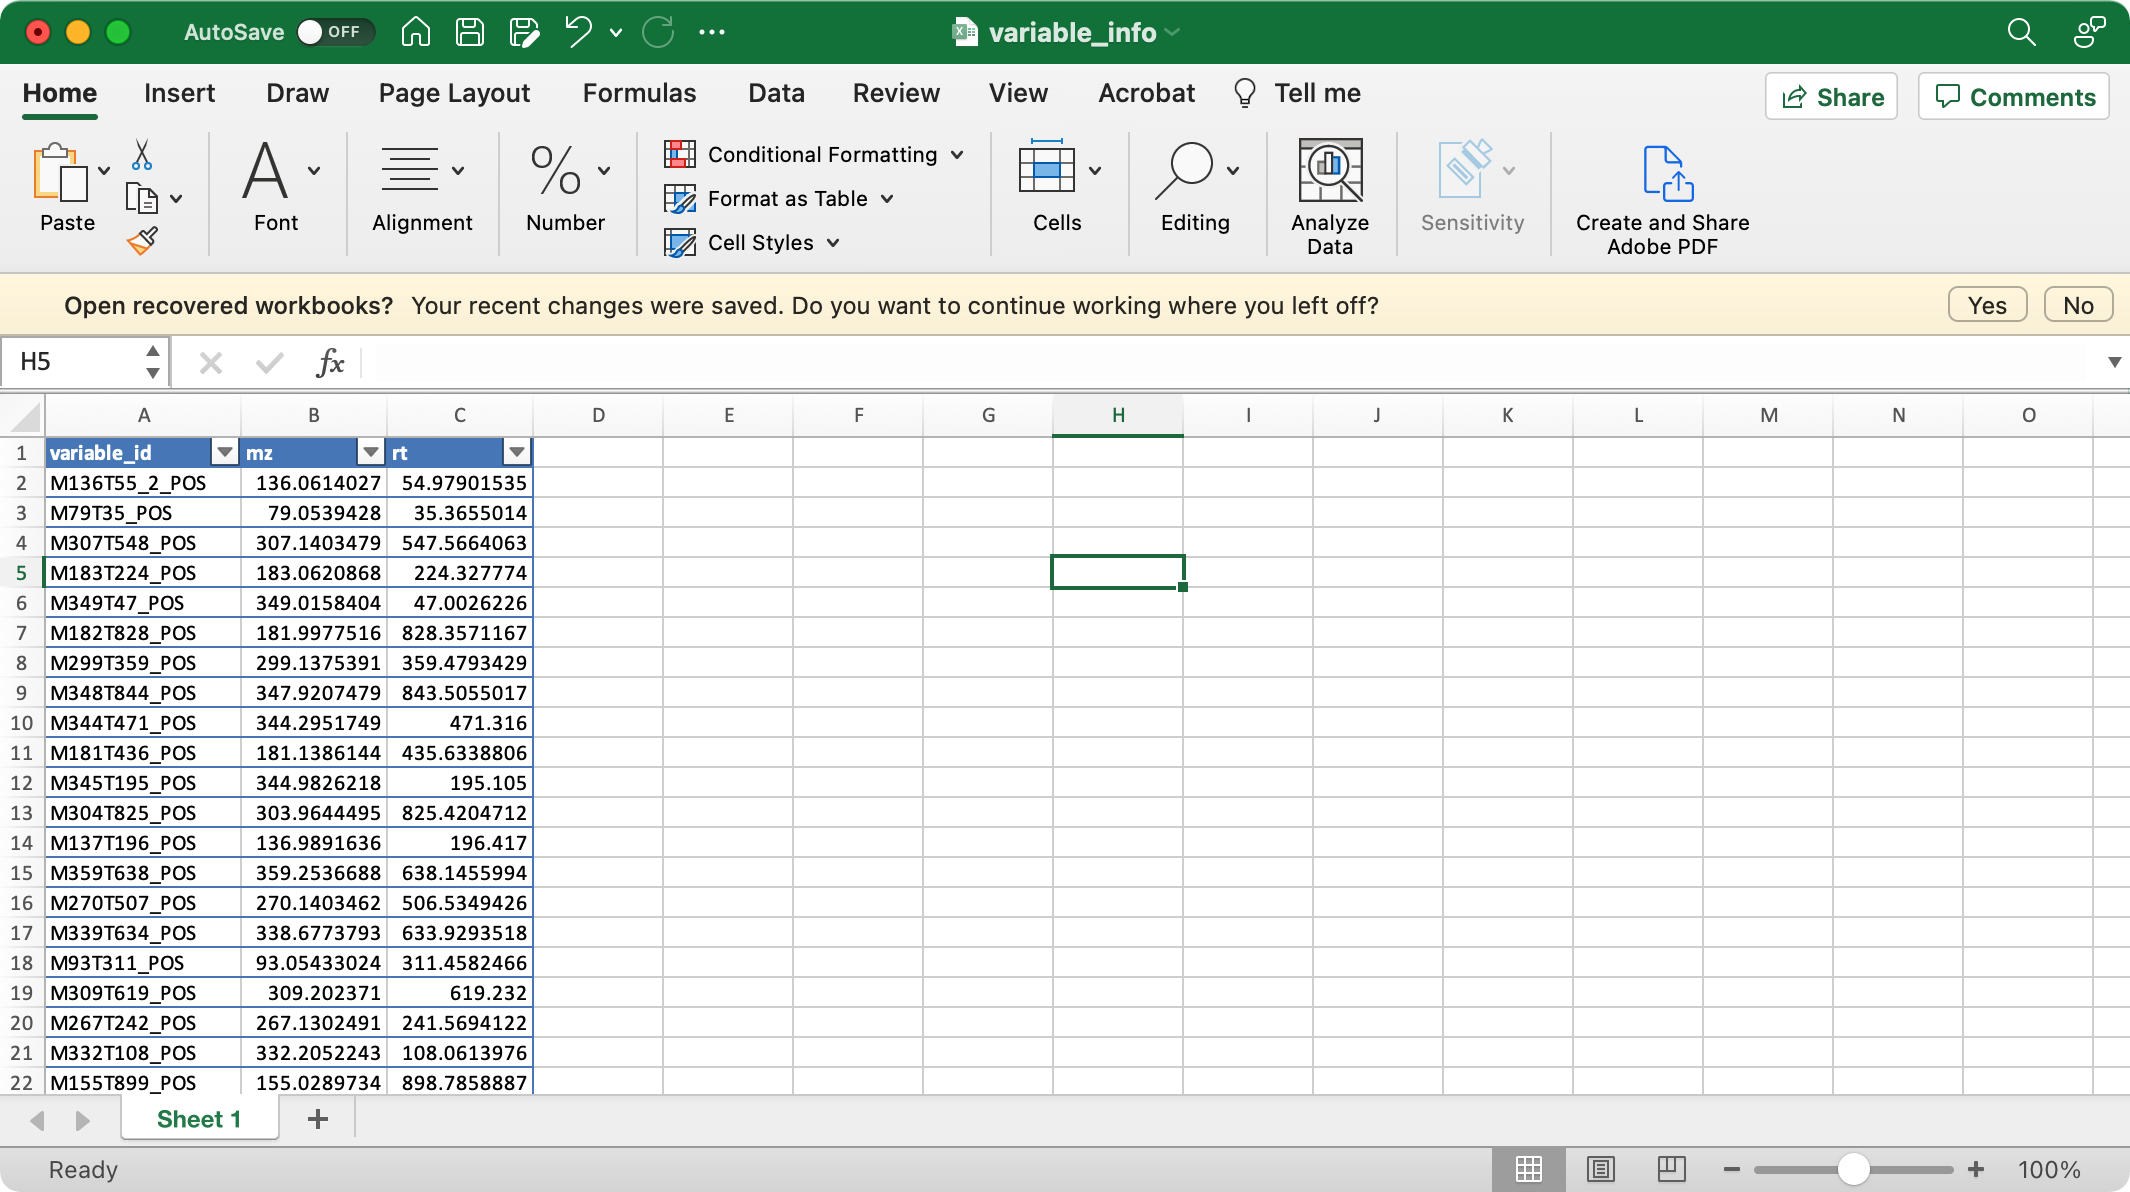
2. variable_info (required)
The columns variable_id (variable ID), mz
(mass to charge ratio), rt (retention time, unit is second)
are required.
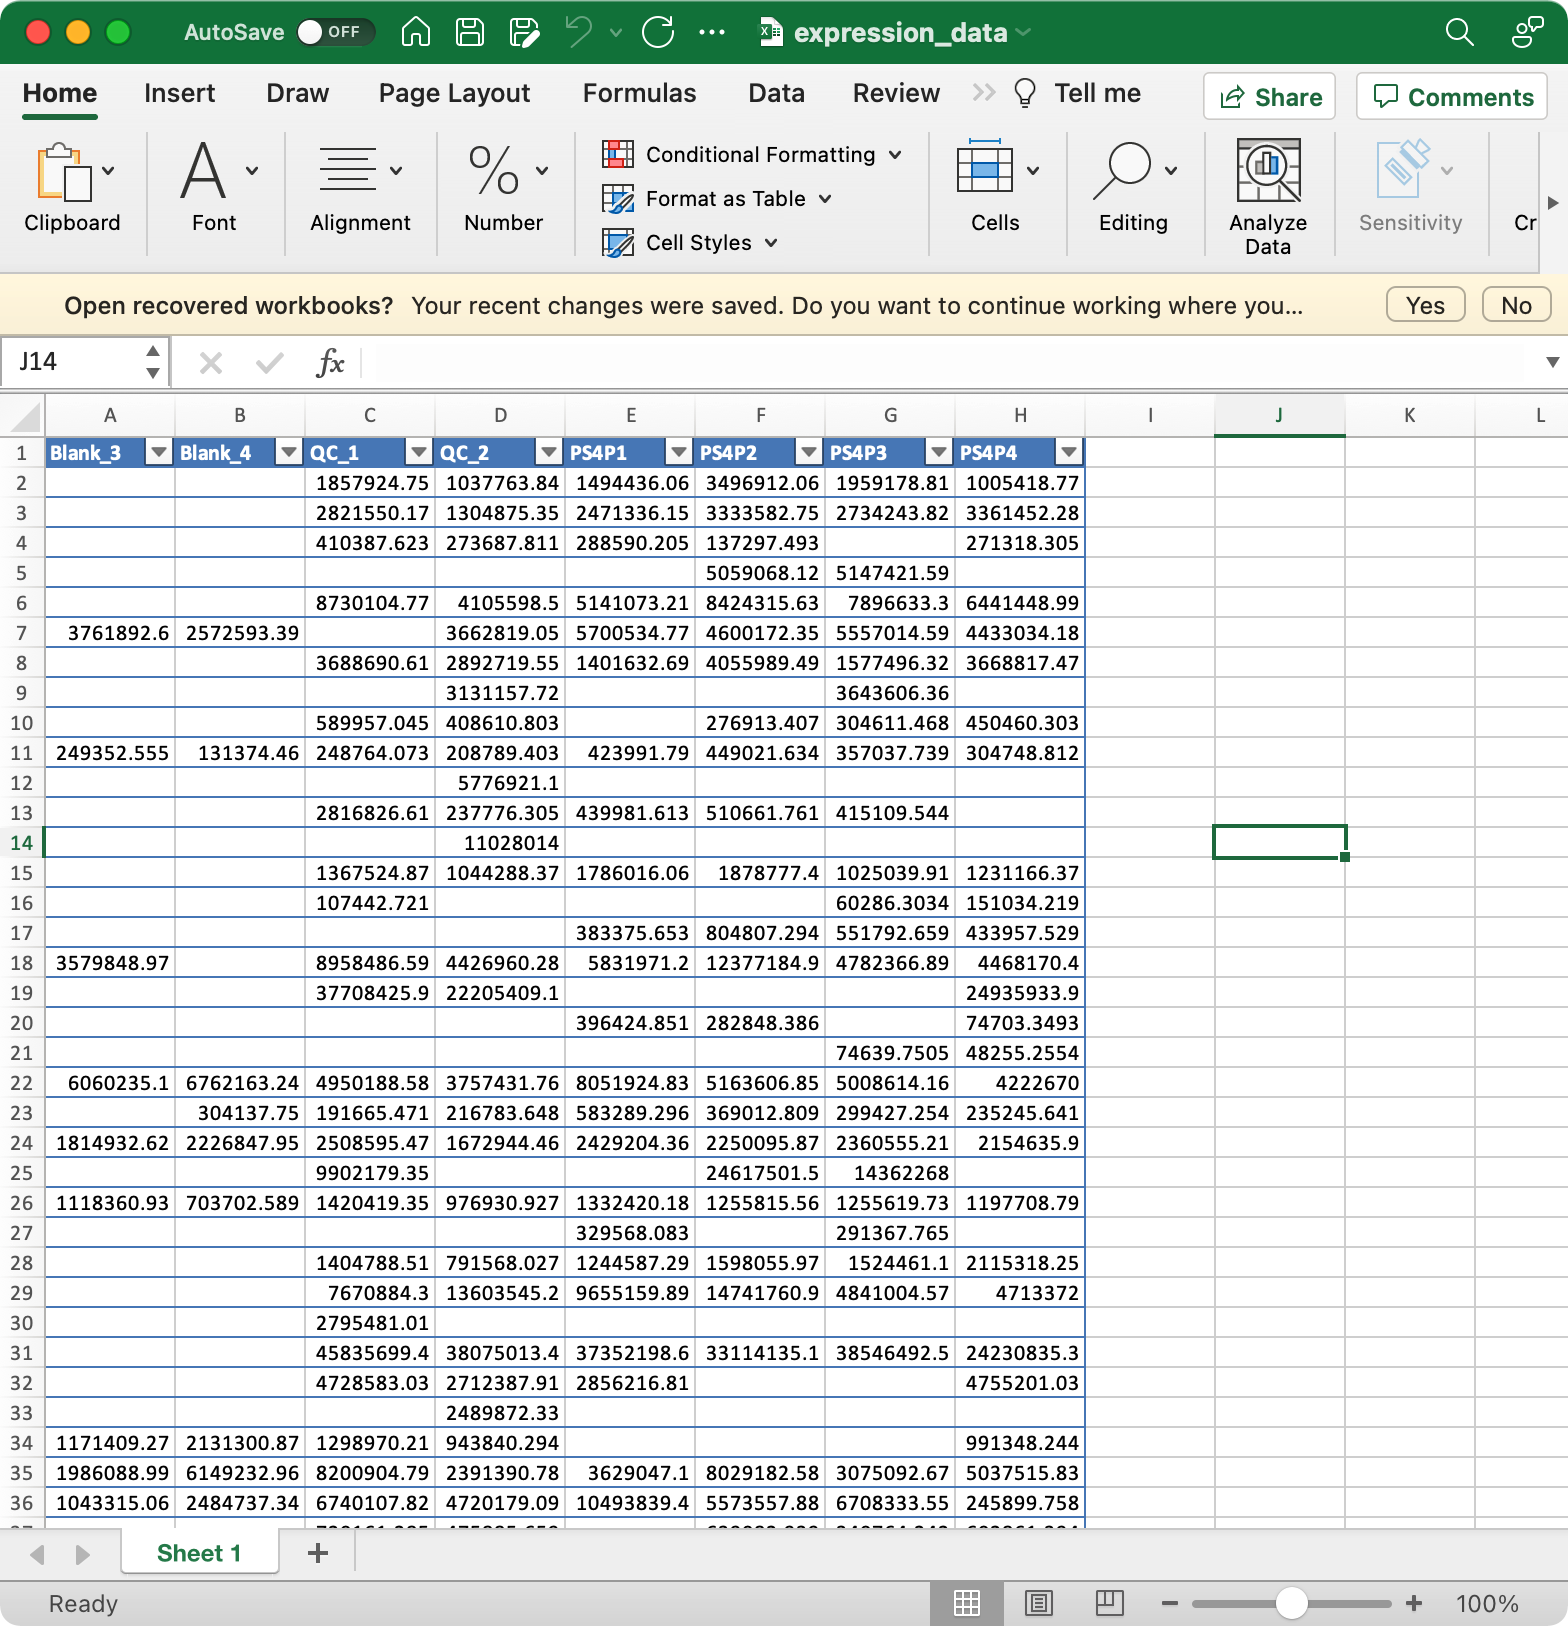
3. expression_data (required)
Columns are samples are rows are features (variables).
The column names of expression_data should be completely same with sample_id in
sample_info, and the row names of expression_data should be completely same with variable_id invariable_info.

Prepare demo data
Here we use the example datasets bundled with
massdataset. This keeps the workflow reproducible while
still showing how the required tables fit together.
library(massdataset)
#> massdataset 0.99.3 (2026-03-04 12:54:01.897435)
#>
#> Attaching package: 'massdataset'
#> The following object is masked from 'package:stats':
#>
#>     filter
library(tidyverse)
#> ── Attaching core tidyverse packages ──────────────────────── tidyverse 2.0.0 ──
#> ✔ forcats   1.0.0     ✔ stringr   1.5.1
#> ✔ lubridate 1.9.4     ✔ tibble    3.3.0
#> ✔ purrr     1.1.0     ✔ tidyr     1.3.1
#> ✔ readr     2.1.5
#> ── Conflicts ────────────────────────────────────────── tidyverse_conflicts() ──
#> ✖ tidyr::extract()   masks magrittr::extract()
#> ✖ dplyr::filter()    masks massdataset::filter(), stats::filter()
#> ✖ dplyr::lag()       masks stats::lag()
#> ✖ purrr::set_names() masks magrittr::set_names()
#> ℹ Use the conflicted package (<http://conflicted.r-lib.org/>) to force all conflicts to become errors
data("expression_data")
data("sample_info")
data("sample_info_note")
data("variable_info")
data("variable_info_note")

sample_info_pos = sample_info
sample_info_neg = sample_info
Make sure the order of samples in sample_info matches
the columns of expression_data.
expression_data_pos = expression_data[, rev(seq_len(ncol(expression_data)))]
expression_data_neg = expression_data

colnames(expression_data_pos) == sample_info_pos$sample_id
#> [1] FALSE FALSE FALSE FALSE FALSE FALSE FALSE FALSE
colnames(expression_data_neg) == sample_info_neg$sample_id
#> [1] TRUE TRUE TRUE TRUE TRUE TRUE TRUE TRUE
The orders of sample_id in sample_info and
column names of expression_data are different.
Create mass_data class object
Then we can create mass_data class object using
create_mass_dataset() function.
object_pos =
  create_mass_dataset(
    expression_data = expression_data_pos,
    sample_info = sample_info_pos,
    variable_info = variable_info,
    sample_info_note = sample_info_note,
    variable_info_note = variable_info_note
  )

object_pos
#> --------------------
#> massdataset version: 0.99.3
#> --------------------
#> 1.expression_data:[ 1000 x 8 data.frame]
#> 2.sample_info:[ 8 x 4 data.frame]
#> 8 samples:Blank_3 Blank_4 QC_1 ... PS4P3 PS4P4
#> 3.variable_info:[ 1000 x 3 data.frame]
#> 1000 variables:M136T55_2_POS M79T35_POS M307T548_POS ... M232T937_POS M301T277_POS
#> 4.sample_info_note:[ 4 x 2 data.frame]
#> 5.variable_info_note:[ 3 x 2 data.frame]
#> 6.ms2_data:[ 0 variables x 0 MS2 spectra]
#> --------------------
#> Processing information
#> 1 processings in total
#> create_mass_dataset ----------
#>       Package         Function.used                Time
#> 1 massdataset create_mass_dataset() 2026-03-04 12:55:02
Then negative mode.
object_neg =
  create_mass_dataset(
    expression_data = expression_data_neg,
    sample_info = sample_info_neg,
    variable_info = variable_info,
    sample_info_note = sample_info_note,
    variable_info_note = variable_info_note
  )

object_neg
#> --------------------
#> massdataset version: 0.99.3
#> --------------------
#> 1.expression_data:[ 1000 x 8 data.frame]
#> 2.sample_info:[ 8 x 4 data.frame]
#> 8 samples:Blank_3 Blank_4 QC_1 ... PS4P3 PS4P4
#> 3.variable_info:[ 1000 x 3 data.frame]
#> 1000 variables:M136T55_2_POS M79T35_POS M307T548_POS ... M232T937_POS M301T277_POS
#> 4.sample_info_note:[ 4 x 2 data.frame]
#> 5.variable_info_note:[ 3 x 2 data.frame]
#> 6.ms2_data:[ 0 variables x 0 MS2 spectra]
#> --------------------
#> Processing information
#> 1 processings in total
#> create_mass_dataset ----------
#>       Package         Function.used                Time
#> 1 massdataset create_mass_dataset() 2026-03-04 12:55:02
Then save them for next analysis.
Export mass_dataset class object to csv for
xlsx
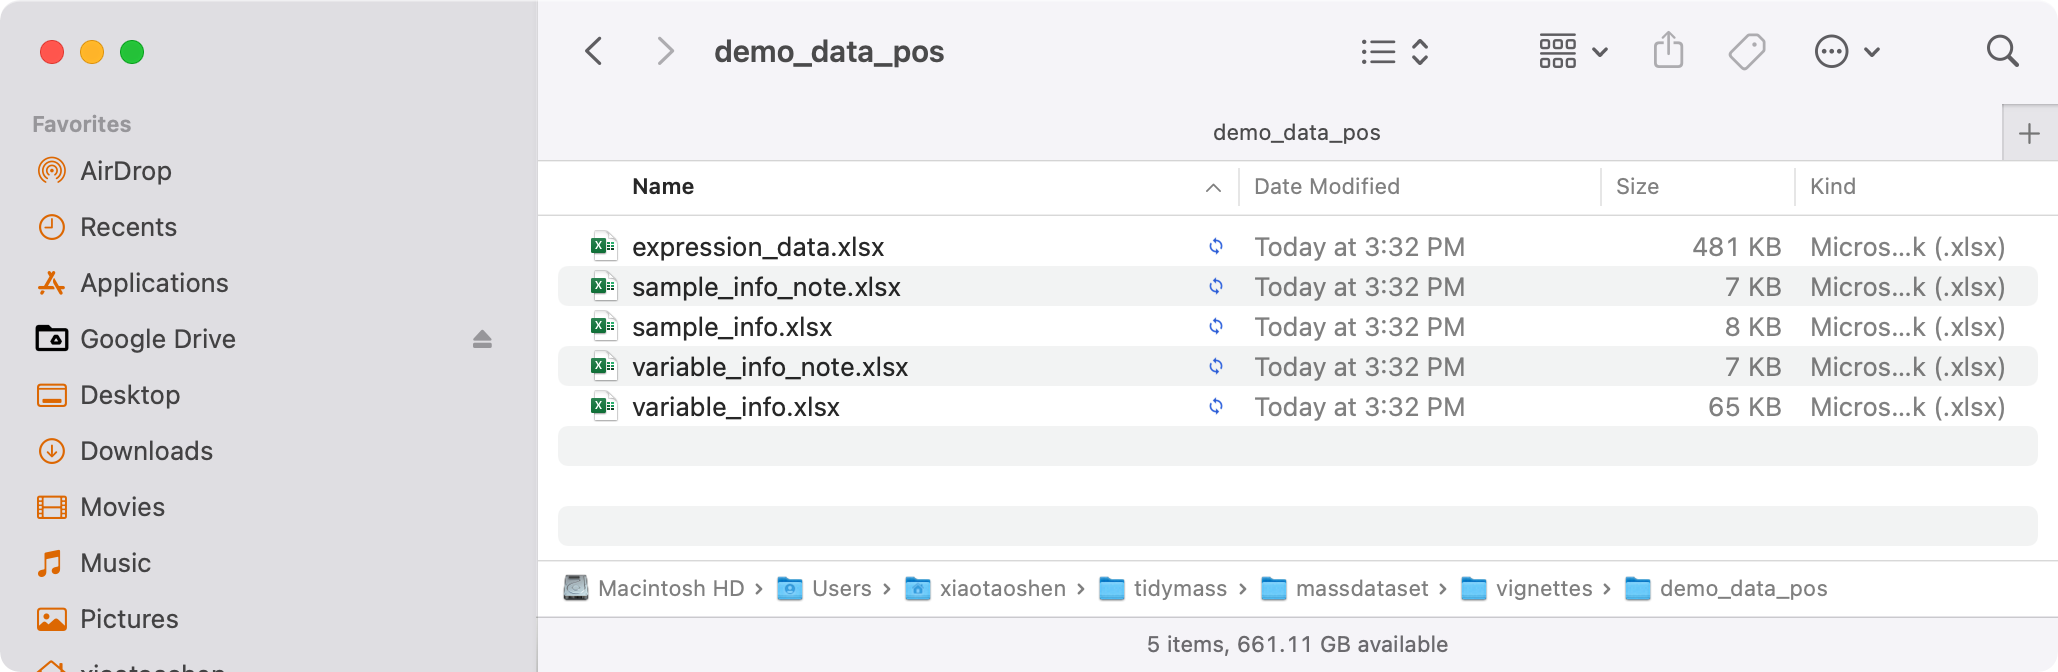
export_dir <- file.path(tempdir(), "demo_data_pos")
export_mass_dataset(object = object_pos,
                    file_type = "xlsx",
                    path = export_dir)

list.files(export_dir)
#> [1] "expression_data.xlsx"    "sample_info_note.xlsx"
#> [3] "sample_info.xlsx"        "variable_info_note.xlsx"
#> [5] "variable_info.xlsx"
Then all the data will be in the temporary export folder.
mzMine feature table to mass_dataset
class
We can also directory convert feature table from mzMine to mass_dataset
class.
An example feature table from mzMine.
| row ID | row m/z | row retention time | 10232_P4_RE4_01_476.mzXML Peak area | 10765_P4_RE9_01_482.mzXML Peak area | 10546_P4_RG11_01_515.mzXML Peak area | 11035_P4_RB4_01_431.mzXML Peak area | 11163_P4_RB11_01_439.mzXML Peak area | 13541_P4_RG3_01_506.mzXML Peak area | 10712_P4_RH3_01_521.mzXML Peak area | 10715_P4_RA4_01_415.mzXML Peak area | 11111_P4_RB1_01_428.mzXML Peak area | 14153_P4_RH8_01_526.mzXML Peak area | 18404_P3_RF6_01_370.mzXML Peak area | 16500_P2_RD8_01_209.mzXML Peak area | 13917_P4_RA10_01_423.mzXML Peak area | 16501_P2_RD9_01_210.mzXML Peak area | 14880_P3_RA3_01_290.mzXML Peak area | 15581_P2_RD4_01_203.mzXML Peak area | 29342_P5_RF3_01_620.mzXML Peak area | 15623_P2_RC3_01_187.mzXML Peak area | 12262_P1_RE5_01_94.mzXML Peak area | 27373_P2_RD5_01_204.mzXML Peak area | 31878_P1_RH3_01_131.mzXML Peak area | 14563_P1_RE10_01_99.mzXML Peak area |
|---|---|---|---|---|---|---|---|---|---|---|---|---|---|---|---|---|---|---|---|---|---|---|---|---|
| 1 | 108.51790 | 10.24505 | 1389687.3 | 1401752.8 | 1402784.6 | 1655499.3 | 1426946.5 | 1405056.0 | 1301424.7 | 1662174.7 | 1669773.7 | 1292471.4 | 1401058.6 | 1255984.4 | 1790633.1 | 1239958.2 | 1384509.0 | 1321642.1 | 1342898.4 | 1428609.7 | 0.00 | 1309347.2 | 0.0000 | 0.00 |
| 2 | 184.98560 | 10.24529 | 824854.7 | 879329.1 | 810711.7 | 918538.4 | 904935.9 | 863844.5 | 813936.4 | 959157.6 | 975521.4 | 819906.7 | 802451.8 | 805424.3 | 999066.5 | 797460.9 | 859813.1 | 821147.8 | 764305.2 | 859406.4 | 319453.12 | 812621.6 | 321342.3140 | 343921.07 |
| 3 | 99.51304 | 10.24432 | 779963.5 | 809016.6 | 784838.3 | 918355.9 | 869348.5 | 825338.8 | 757906.5 | 890287.1 | 945978.1 | 779467.9 | 784715.8 | 698338.0 | 995229.3 | 690797.5 | 755029.2 | 725875.2 | 727123.5 | 804957.8 | 0.00 | 729996.3 | 38.4895 | 0.00 |
| 4 | 176.97199 | 10.45647 | 3371036.7 | 3594238.9 | 3335427.7 | 4762133.2 | 4446552.3 | 4146207.6 | 3450606.1 | 4270036.0 | 4082635.8 | 3346233.6 | 3600719.2 | 2005356.9 | 5118346.2 | 1864347.1 | 3200536.9 | 2686899.7 | 2419853.5 | 2592535.7 | 28303.96 | 2038650.8 | 83238.3495 | 83362.95 |
| 6 | 186.95641 | 10.47076 | 3649387.6 | 2918579.6 | 3566568.1 | 3498499.8 | 4051221.1 | 3776597.5 | 3112945.0 | 4300303.6 | 3604041.9 | 3146833.4 | 2953320.1 | 2684678.0 | 4608083.2 | 2684874.6 | 2989385.9 | 2762750.3 | 2746261.2 | 2481040.3 | 100953.59 | 2617117.7 | 430218.5365 | 368020.74 |
| 7 | 108.51790 | 12.79046 | 799957.0 | 761629.2 | 746393.3 | 899613.6 | 790027.6 | 766091.8 | 671510.8 | 944502.5 | 971766.8 | 685098.2 | 849756.6 | 542205.9 | 1032801.9 | 545116.5 | 638052.2 | 597619.4 | 794760.3 | 720902.4 | 0.00 | 588069.0 | 0.0000 | 0.00 |
data("mzmine_table")
object =
   convet_mzmine2mass_dataset(x = mzmine_table)
object
#> --------------------
#> massdataset version: 0.99.3
#> --------------------
#> 1.expression_data:[ 3443 x 22 data.frame]
#> 2.sample_info:[ 22 x 2 data.frame]
#> 22 samples:10232_P4_RE4_01_476.mzXML Peak area 10765_P4_RE9_01_482.mzXML Peak area 10546_P4_RG11_01_515.mzXML Peak area ... 31878_P1_RH3_01_131.mzXML Peak area 14563_P1_RE10_01_99.mzXML Peak area
#> 3.variable_info:[ 3443 x 3 data.frame]
#> 3443 variables:1 2 3 ... 12248 12382
#> 4.sample_info_note:[ 2 x 2 data.frame]
#> 5.variable_info_note:[ 3 x 2 data.frame]
#> 6.ms2_data:[ 0 variables x 0 MS2 spectra]
#> --------------------
#> Processing information
#> 1 processings in total
#> create_mass_dataset ----------
#>       Package                Function.used                Time
#> 1 massdataset convet_mzmine2mass_dataset() 2026-03-04 12:55:02
MS-DIAL feature table to mass_dataset
class
We can also directly convert feature tables from MS-DIAL to a
mass_dataset object.
An example feature table from MS-DIAL.
| V1 | V2 | V3 | V4 | V5 | V6 | V7 | V8 | V9 | V10 | V11 | V12 | V13 | V14 | V15 | V16 | V17 | V18 | V19 | V20 | V21 | V22 | V23 | V24 | V25 | V26 | V27 | V28 | V29 | V30 | V31 | V32 | V33 | V34 | V35 | V36 | V37 | V38 | V39 | V40 | V41 | V42 | V43 | V44 | V45 | V46 | V47 | V48 | V49 | V50 | V51 | V52 | V53 | V54 |
|---|---|---|---|---|---|---|---|---|---|---|---|---|---|---|---|---|---|---|---|---|---|---|---|---|---|---|---|---|---|---|---|---|---|---|---|---|---|---|---|---|---|---|---|---|---|---|---|---|---|---|---|---|---|
| Class | 1 | 1 | 1 | 1 | 1 | 1 | 1 | 1 | 1 | 1 | 1 | 1 | 1 | 1 | 1 | 1 | 1 | 1 | 1 | 1 | NA | NA | |||||||||||||||||||||||||||||||
| File type | Sample | Sample | Sample | Sample | Sample | Sample | Sample | Sample | Sample | Sample | Sample | Sample | Sample | Sample | Sample | Sample | Sample | Sample | Sample | Sample | NA | NA | |||||||||||||||||||||||||||||||
| Injection order | 1 | 2 | 3 | 4 | 5 | 6 | 7 | 8 | 9 | 10 | 11 | 12 | 13 | 14 | 15 | 16 | 17 | 18 | 19 | 20 | NA | NA | |||||||||||||||||||||||||||||||
| Batch ID | 1 | 1 | 1 | 1 | 1 | 1 | 1 | 1 | 1 | 1 | 1 | 1 | 1 | 1 | 1 | 1 | 1 | 1 | 1 | 1 | Average | Stdev | |||||||||||||||||||||||||||||||
| Alignment ID | Average Rt(min) | Average Mz | Metabolite name | Adduct type | Post curation result | Fill % | MS/MS assigned | Reference RT | Reference m/z | Formula | Ontology | INCHIKEY | SMILES | Annotation tag (VS1.0) | RT matched | m/z matched | MS/MS matched | Comment | Manually modified for quantification | Manually modified for annotation | Isotope tracking parent ID | Isotope tracking weight number | Total score | RT similarity | Dot product | Reverse dot product | Fragment presence % | S/N average | Spectrum reference file name | MS1 isotopic spectrum | MS/MS spectrum | W03.01 | W03.02 | W03.03 | W03.04 | W03.05 | W03.06 | W03.07 | W03.08 | W03.09 | W03.10 | W30.01 | W30.02 | W30.03 | W30.04 | W30.05 | W30.06 | W30.07 | W30.08 | W30.09 | W30.10 | 1 | 1 |
| 0 | 1.091 | 60.04458 | Unknown | [M+H]+ | 0.6 | False | null | null | null | null | null | null | 999 | False | False | False | False | False | null | null | null | null | null | null | null | 15.17 | W30.08 | 60.04458:6394 61.04793:179 62.05129:0 | 72102 | 59455 | 61155 | 75126 | 70122 | 69224 | 71378 | 69357 | 76841 | 63669 | 71999 | 44361 | 71829 | 68214 | 46249 | 73209 | 39180 | 70302 | 47150 | 44413 | 63266.802734375 | 12079.2830605498 | |||
| 1 | 8.132 | 60.07921 | Unknown | [M+H]+ | found in higher mzs MsMs_115; found in higher mzs MsMs_3482 | 1 | True | null | null | null | null | null | null | 999 | False | False | False | False | False | null | null | null | null | null | null | null | 40.32 | W03.01 | 60.08072:10877 61.08407:315 62.08743:0 | 42.03227:122 43.01649:1202 43.03581:98 44.0484:592 60.08133:49 | 124220 | 117089 | 134748 | 117222 | 116787 | 129138 | 117582 | 124574 | 117542 | 112126 | 64263 | 136636 | 119736 | 125756 | 142278 | 130580 | 127754 | 129261 | 135510 | 129017 | 122590.935742188 | 15891.7745234752 |
data("msdial_table")
object =
   convert_msdial2mass_dataset(x = msdial_table)
object
#> --------------------
#> massdataset version: 0.99.3
#> --------------------
#> 1.expression_data:[ 3751 x 20 data.frame]
#> 2.sample_info:[ 20 x 5 data.frame]
#> 20 samples:W03.01 W03.02 W03.03 ... W30.09 W30.10
#> 3.variable_info:[ 3751 x 32 data.frame]
#> 3751 variables:0 1 2 ... 6716 6717
#> 4.sample_info_note:[ 5 x 2 data.frame]
#> 5.variable_info_note:[ 32 x 2 data.frame]
#> 6.ms2_data:[ 0 variables x 0 MS2 spectra]
#> --------------------
#> Processing information
#> 1 processings in total
#> create_mass_dataset ----------
#>       Package                 Function.used                Time
#> 1 massdataset convert_msdial2mass_dataset() 2026-03-04 12:55:03
Session information
sessionInfo()
#> R version 4.5.2 (2025-10-31)
#> Platform: aarch64-apple-darwin20
#> Running under: macOS Tahoe 26.3
#>
#> Matrix products: default
#> BLAS:   /System/Library/Frameworks/Accelerate.framework/Versions/A/Frameworks/vecLib.framework/Versions/A/libBLAS.dylib
#> LAPACK: /Library/Frameworks/R.framework/Versions/4.5-arm64/Resources/lib/libRlapack.dylib;  LAPACK version 3.12.1
#>
#> locale:
#> [1] en_US.UTF-8/en_US.UTF-8/en_US.UTF-8/C/en_US.UTF-8/en_US.UTF-8
#>
#> time zone: Asia/Singapore
#> tzcode source: internal
#>
#> attached base packages:
#> [1] stats     graphics  grDevices utils     datasets  methods   base
#>
#> other attached packages:
#>  [1] kableExtra_1.4.0   lubridate_1.9.4    forcats_1.0.0      stringr_1.5.1
#>  [5] purrr_1.1.0        readr_2.1.5        tidyr_1.3.1        tibble_3.3.0
#>  [9] tidyverse_2.0.0    magrittr_2.0.3     dplyr_1.1.4        ggplot2_4.0.2
#> [13] massdataset_0.99.3
#>
#> loaded via a namespace (and not attached):
#>  [1] tidyselect_1.2.1            viridisLite_0.4.2
#>  [3] farver_2.1.2                S7_0.2.0
#>  [5] fastmap_1.2.0               digest_0.6.37
#>  [7] timechange_0.3.0            lifecycle_1.0.4
#>  [9] cluster_2.1.8.1             compiler_4.5.2
#> [11] rlang_1.1.6                 sass_0.4.10
#> [13] tools_4.5.2                 yaml_2.3.10
#> [15] knitr_1.50                  S4Arrays_1.8.1
#> [17] htmlwidgets_1.6.4           DelayedArray_0.34.1
#> [19] xml2_1.4.0                  RColorBrewer_1.1-3
#> [21] abind_1.4-8                 withr_3.0.2
#> [23] BiocGenerics_0.54.0         desc_1.4.3
#> [25] grid_4.5.2                  stats4_4.5.2
#> [27] colorspace_2.1-1            scales_1.4.0
#> [29] iterators_1.0.14            dichromat_2.0-0.1
#> [31] SummarizedExperiment_1.38.1 cli_3.6.5
#> [33] rmarkdown_2.29              crayon_1.5.3
#> [35] ragg_1.4.0                  generics_0.1.4
#> [37] rstudioapi_0.17.1           httr_1.4.7
#> [39] tzdb_0.5.0                  rjson_0.2.23
#> [41] cachem_1.1.0                parallel_4.5.2
#> [43] XVector_0.48.0              matrixStats_1.5.0
#> [45] vctrs_0.6.5                 Matrix_1.7-4
#> [47] jsonlite_2.0.0              IRanges_2.42.0
#> [49] hms_1.1.3                   GetoptLong_1.0.5
#> [51] S4Vectors_0.48.0            clue_0.3-66
#> [53] systemfonts_1.2.3           foreach_1.5.2
#> [55] jquerylib_0.1.4             glue_1.8.0
#> [57] pkgdown_2.1.3               codetools_0.2-20
#> [59] stringi_1.8.7               shape_1.4.6.1
#> [61] gtable_0.3.6                GenomeInfoDb_1.44.2
#> [63] GenomicRanges_1.60.0        UCSC.utils_1.4.0
#> [65] ComplexHeatmap_2.24.1       pillar_1.11.0
#> [67] htmltools_0.5.8.1           GenomeInfoDbData_1.2.14
#> [69] circlize_0.4.16             R6_2.6.1
#> [71] textshaping_1.0.1           doParallel_1.0.17
#> [73] evaluate_1.0.4              Biobase_2.68.0
#> [75] lattice_0.22-7              png_0.1-8
#> [77] openxlsx_4.2.8              bslib_0.9.0
#> [79] Rcpp_1.1.0                  zip_2.3.3
#> [81] svglite_2.2.1               SparseArray_1.8.1
#> [83] xfun_0.53                   fs_1.6.6
#> [85] MatrixGenerics_1.20.0       pkgconfig_2.0.3
#> [87] GlobalOptions_0.1.2