Align different batch peak tables
Xiaotao Shen (https://www.shenxt.info/)
true
Created on 2020-04-01 and updated on 2021-04-07
Source:vignettes/align_batch.Rmd
align_batch.RmdSome times if you have more than two batch peak tables, and they are processed at different times, so you need to align them together before other analysis. In metflow2, we use the align_batch() function to do that.
Data preparation
Peak table
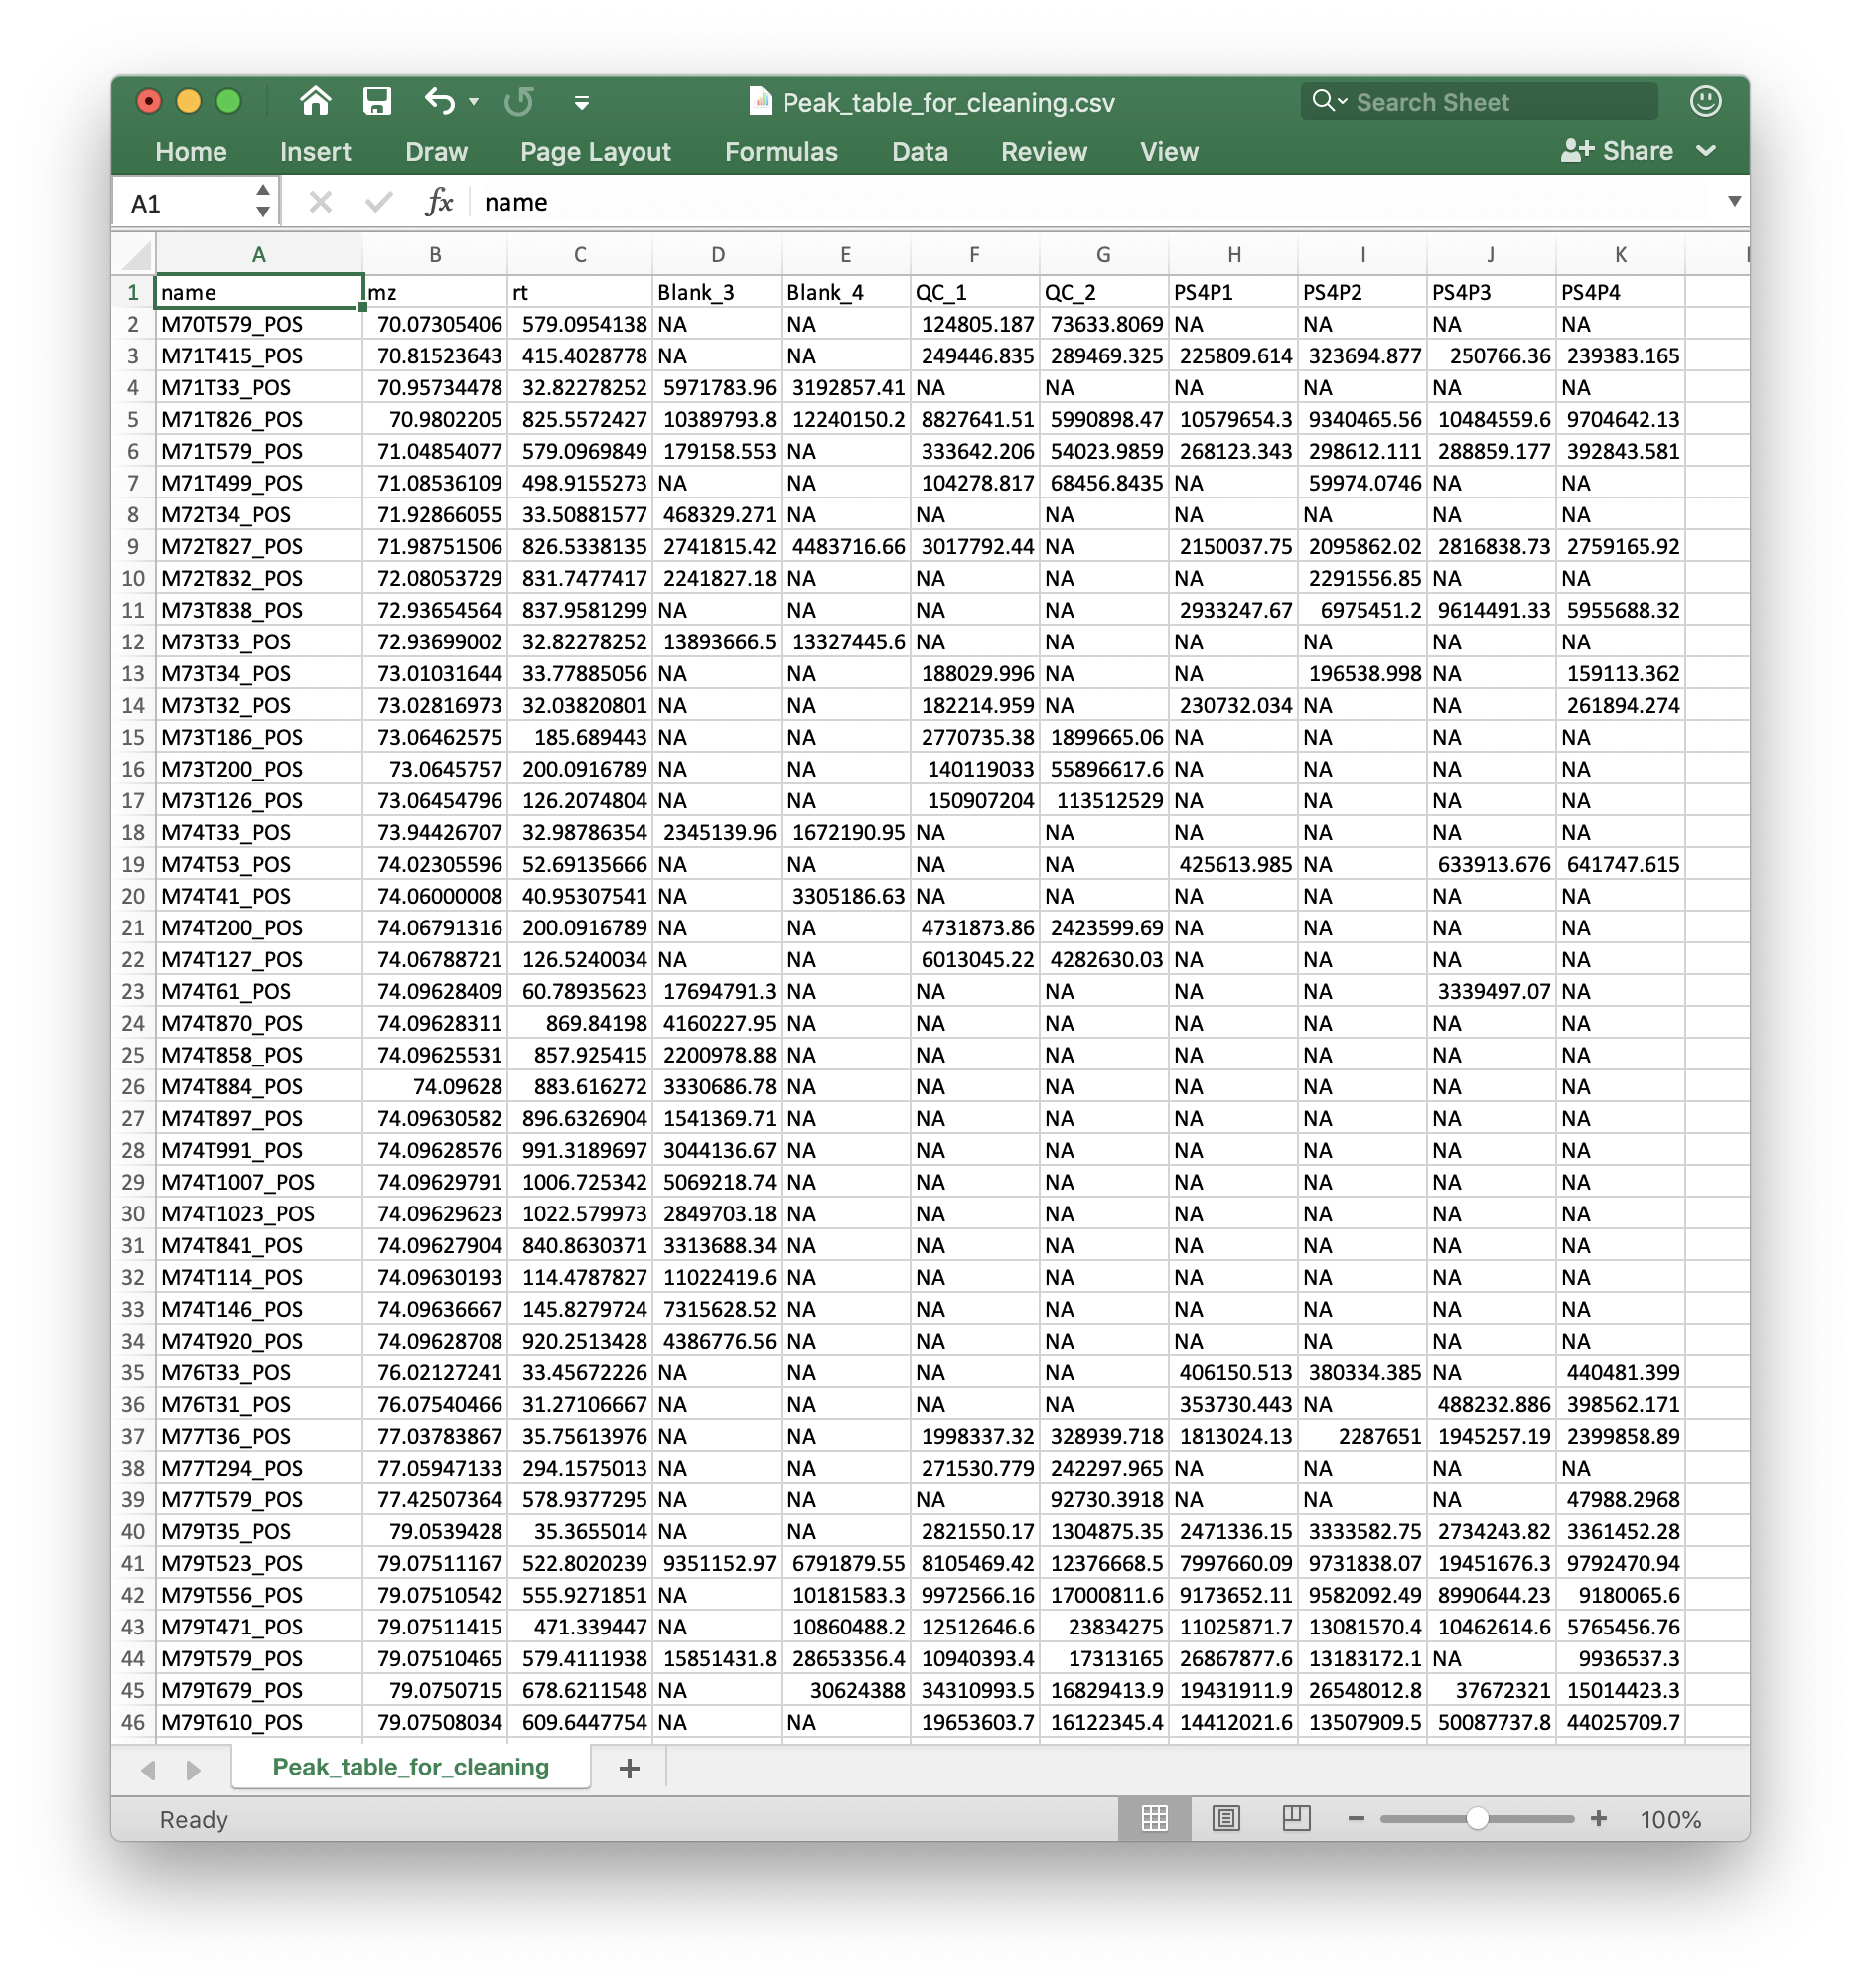
The peak table (csv format) can be from any software. We recomment that you use the Peak_table_for_cleaning.csv from processData() function from metflow2.
If you use other software, please make sure that the top 3 columns are name (peak name), mz and rt (retention time, second). And the left column are sample intensity.
Read data
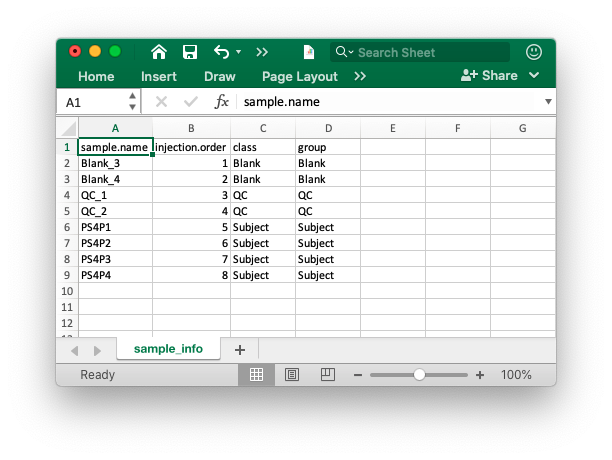
Then place the peak table and sample information in a folder. We use the demo data from demoData package.
Load demo data
##create a folder named as example
path <- file.path(".", "example")
dir.create(path = path, showWarnings = FALSE)
##get demo data
demo_data <- system.file("metflow2", package = "demoData")

file.copy(from = file.path(demo_data, dir(demo_data)),
          to = path, overwrite = TRUE, recursive = TRUE)
#> [1] TRUE TRUE TRUE TRUE TRUE
Here, we have two peak tables, batch1.data.csv and batch2.data.csv, and sample_info.csv are in your ./example folder.
Creat metflowClass object
object <-
  create_metflow_object(
    ms1.data = c("batch1.data.csv", "batch2.data.csv"),
    sample.information = "sample_info.csv",
    path = path
  )
#> `creatMetflowObject()` is deprecated, please use `create_metflow_object()`Reading data...
#> --------------------------------------------------------------
#> --------------------------------------------------------------
#> --------------------------------------------------------------
#> Summary:
#>             Check result OK Warning Error
#> batch1             Valid  3       0     0
#> batch2             Valid  3       0     0
#> sample.info        Valid  9       0     0
#>
#>
#> data:
#> Batch 1 is valid.
#> Batch 2 is valid.
#>
#> sample.info:
#> sample.info is valid.
object is a metflowClass object, so you can print it in the console.
object
#> --------------------
#> metflow2 version: 0.1.0
#> --------------------
#> MS1 data
#> There are 2 peak tables in your MS1 data.
#>        Peak.number Column.number
#> Batch1         500           220
#> Batch2         500           220
#> --------------------
#> There are 434 samples in your MS1 data.
#>     Class Number
#> 1      QC     50
#> 2 Subject    384
#> --------------------
#>   Group Number
#> 1     0    103
#> 2     1    281
#> 3    QC     50
#> --------------------
#> Processing
#> There are no processing for your data.
Run align_batch() function
object2 <- align_batch(object = object,
            combine.mz.tol = 15,
            combine.rt.tol = 30,
            use.int.tol = FALSE)
#> Rough aligning...
#> Accurate aligning...
object2
#> --------------------
#> metflow2 version: 0.1.0
#> --------------------
#> MS1 data
#> There are 1 peak tables in your MS1 data.
#>        Peak.number Column.number
#> Batch1         354           437
#> --------------------
#> There are 434 samples in your MS1 data.
#>     Class Number
#> 1      QC     50
#> 2 Subject    384
#> --------------------
#>   Group Number
#> 1     0    103
#> 2     1    281
#> 3    QC     50
#> --------------------
#> Processing
#> alignBatch ----------
#>        Parameter Value
#> 1 combine.mz.tol    15
#> 2 combine.rt.tol    30
#> combine.mz.tol

#> combine.rt.tol