show missing values for each variable
Usage
show_variable_missing_values(
  object,
  color_by,
  order_by,
  percentage = FALSE,
  show_x_text = FALSE,
  show_x_ticks = FALSE,
  desc = FALSE
)
Arguments
- object
(required) mass_dataset class object.
- color_by
which column (in variable_info) is used to color variables
- order_by
which column (in variable_info) is used to order variables
- percentage
show MV percentage? TRUE or FALSE
- show_x_text
show x axis text or not? TRUE or FALSE
- show_x_ticks
show x ticks or not? TRUE or FALSE
- desc
descend sample order or not. TRUE or FALSE.
Author
Xiaotao Shen xiaotao.shen@outlook.com
Examples
data("expression_data")
data("sample_info")
data("variable_info")
object <- create_mass_dataset(
expression_data = expression_data,
sample_info = sample_info,
variable_info = variable_info
)
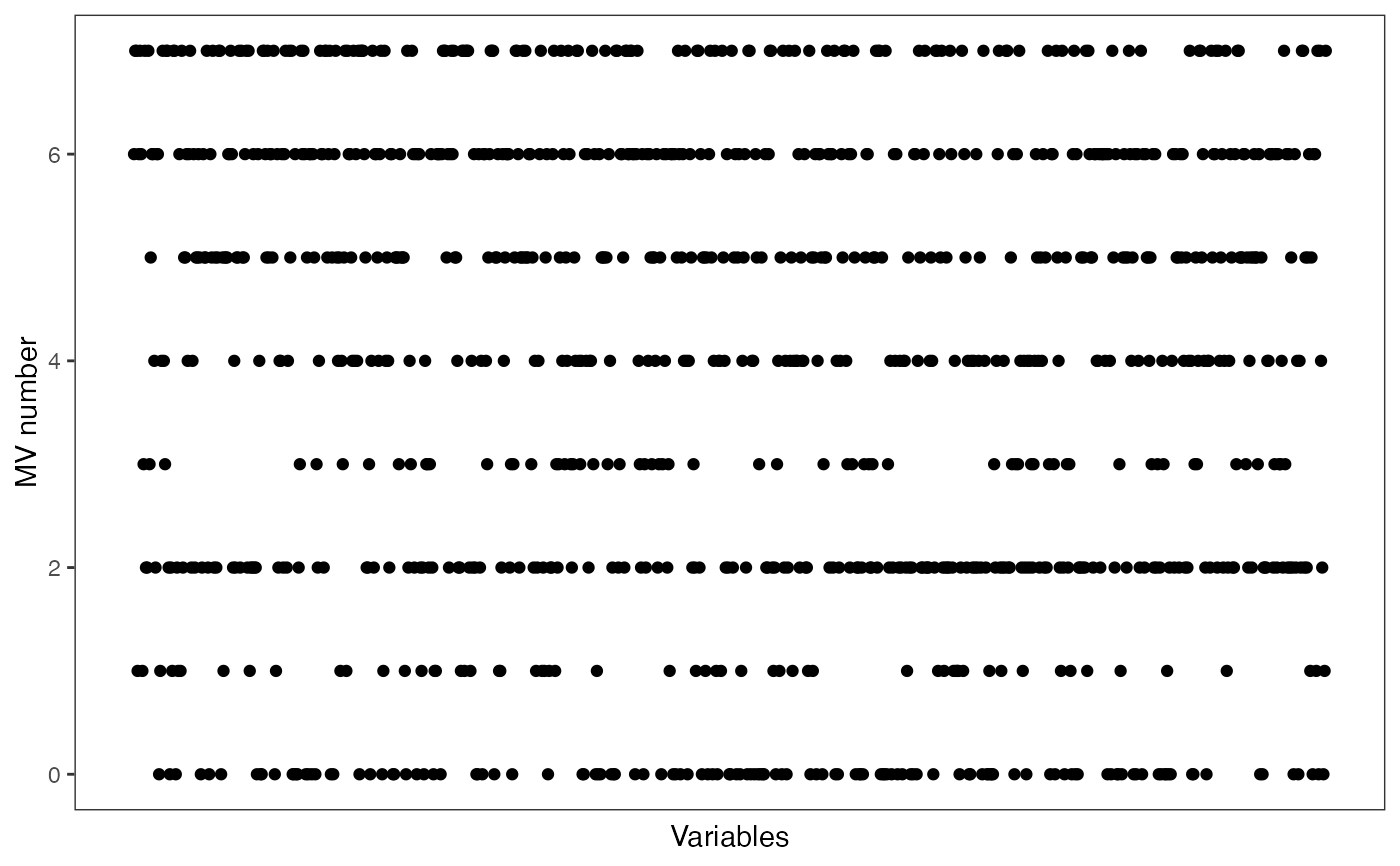
show_variable_missing_values(object)
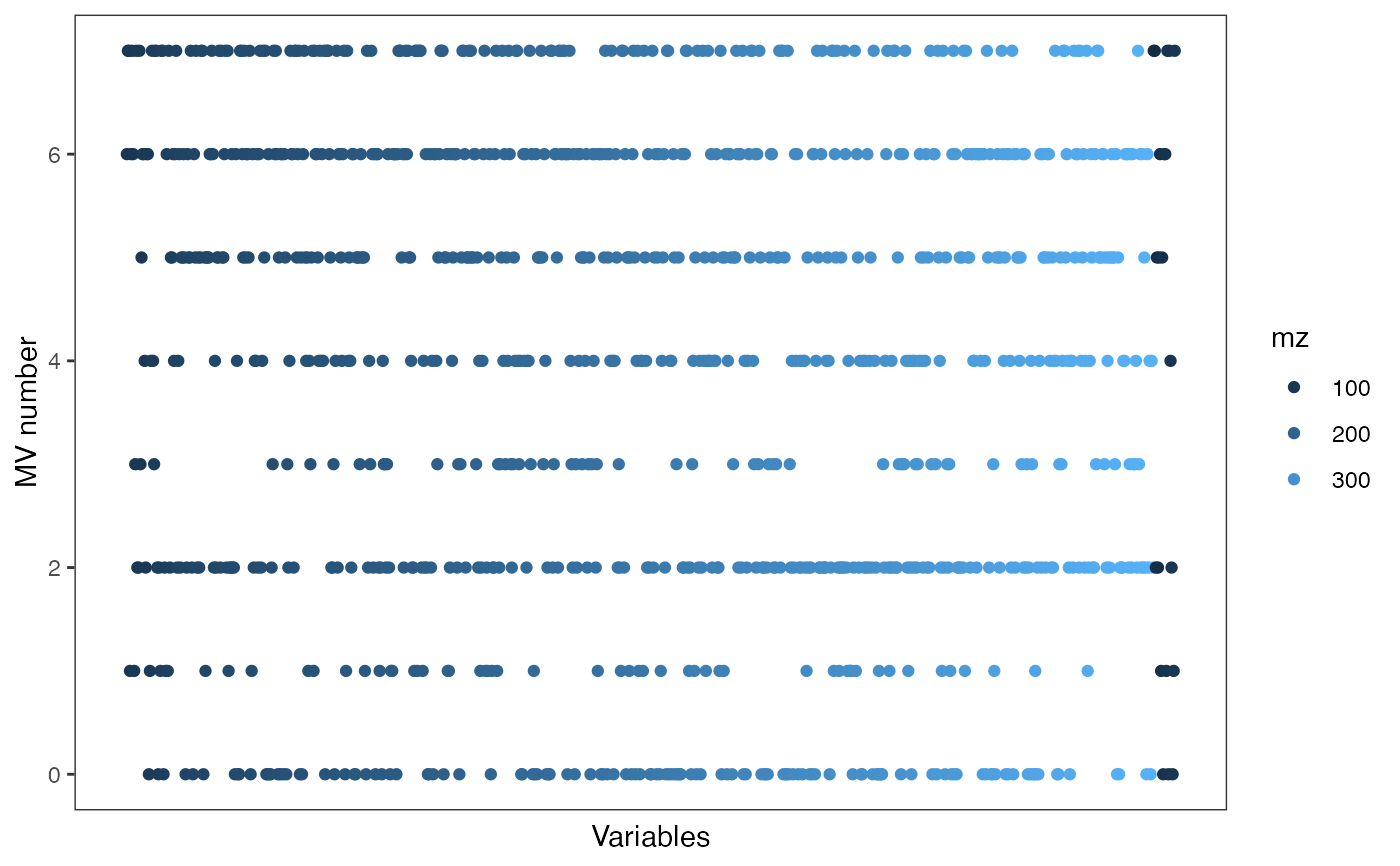
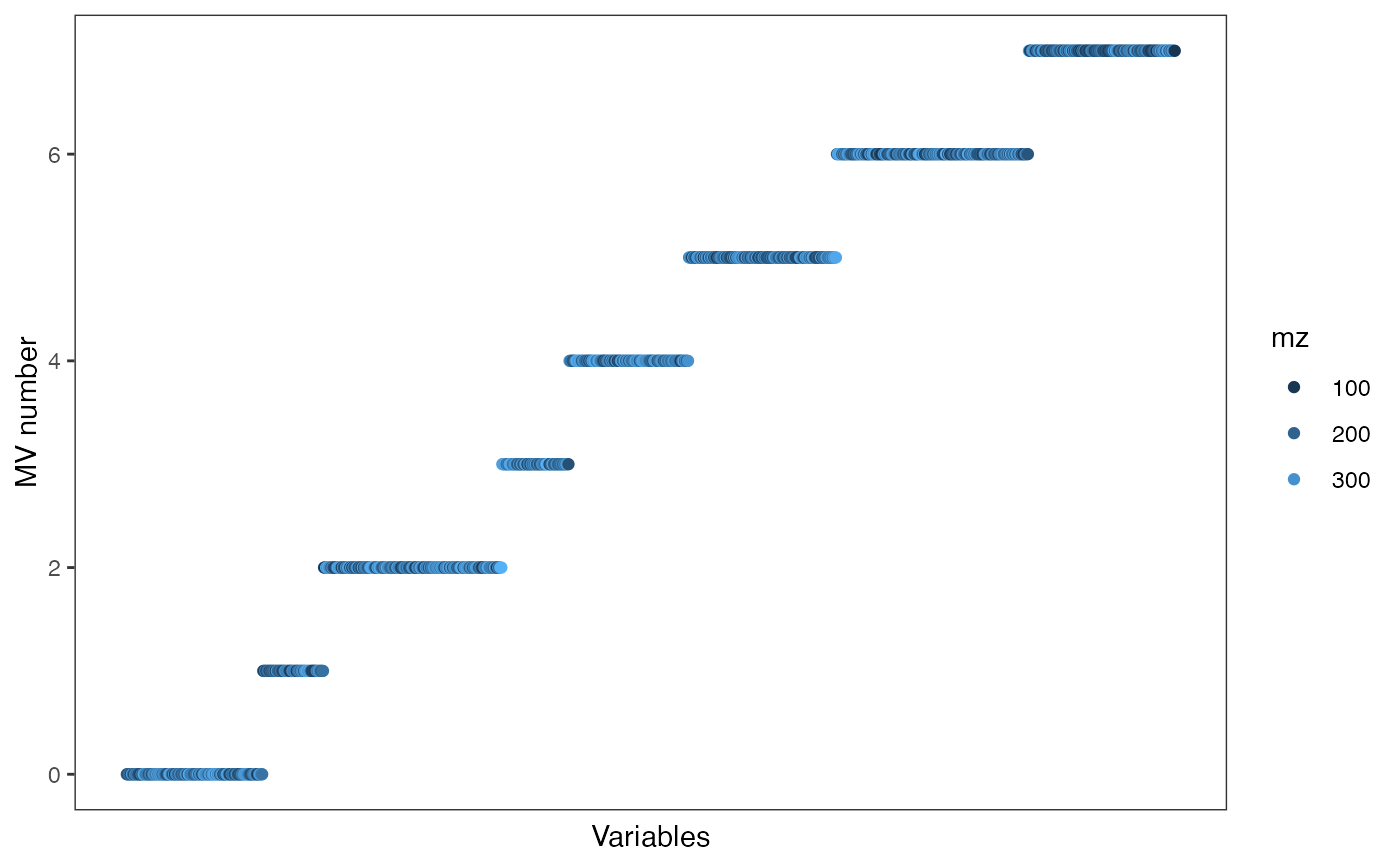
 show_variable_missing_values(object, color_by = "mz")
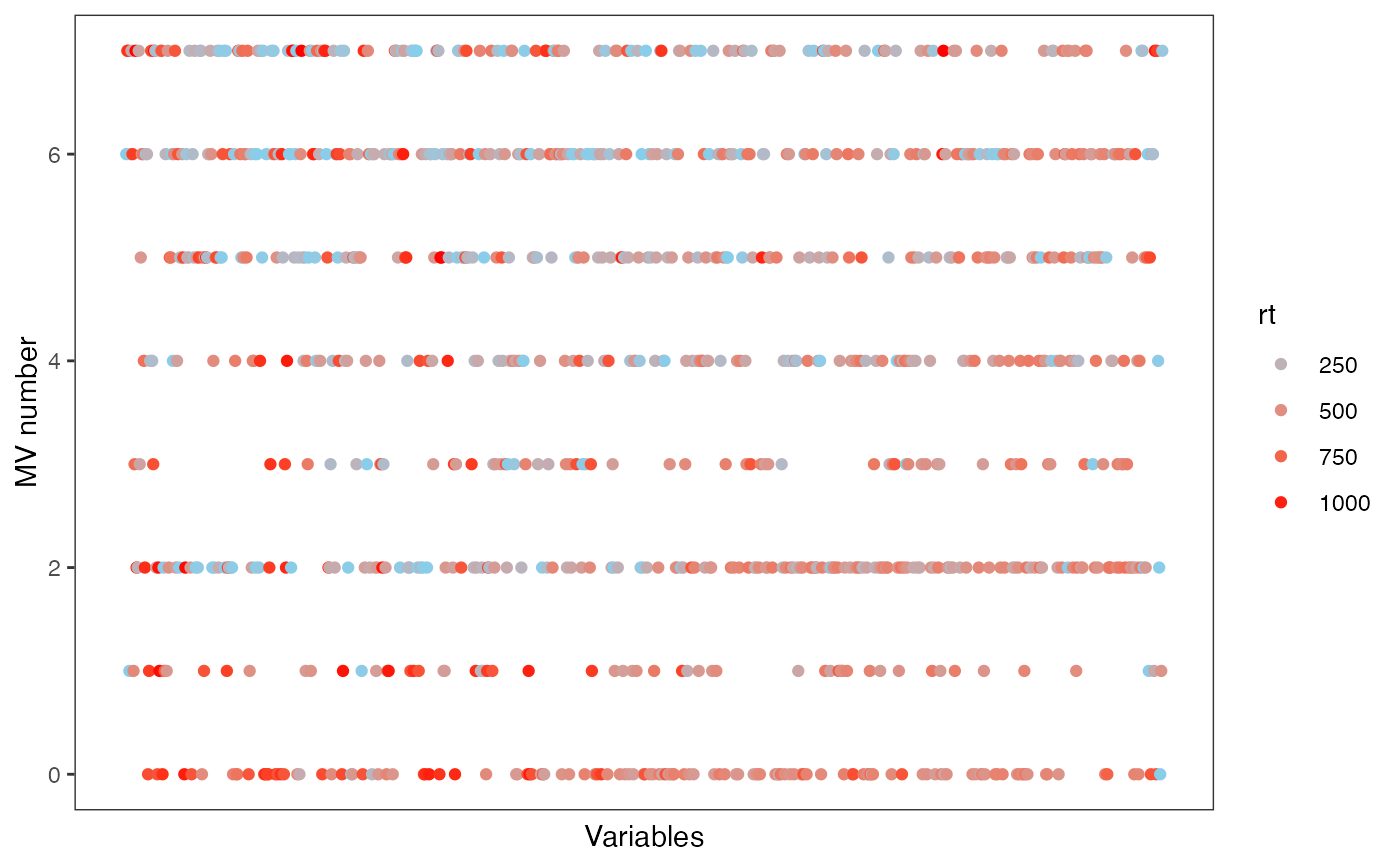
 show_variable_missing_values(object, color_by = "rt") +
ggplot2::scale_color_gradient(low = "skyblue", high = "red")
show_variable_missing_values(object, color_by = "rt") +
ggplot2::scale_color_gradient(low = "skyblue", high = "red")
 show_variable_missing_values(object, color_by = "mz",
order_by = "na")
show_variable_missing_values(object, color_by = "mz",
order_by = "na")
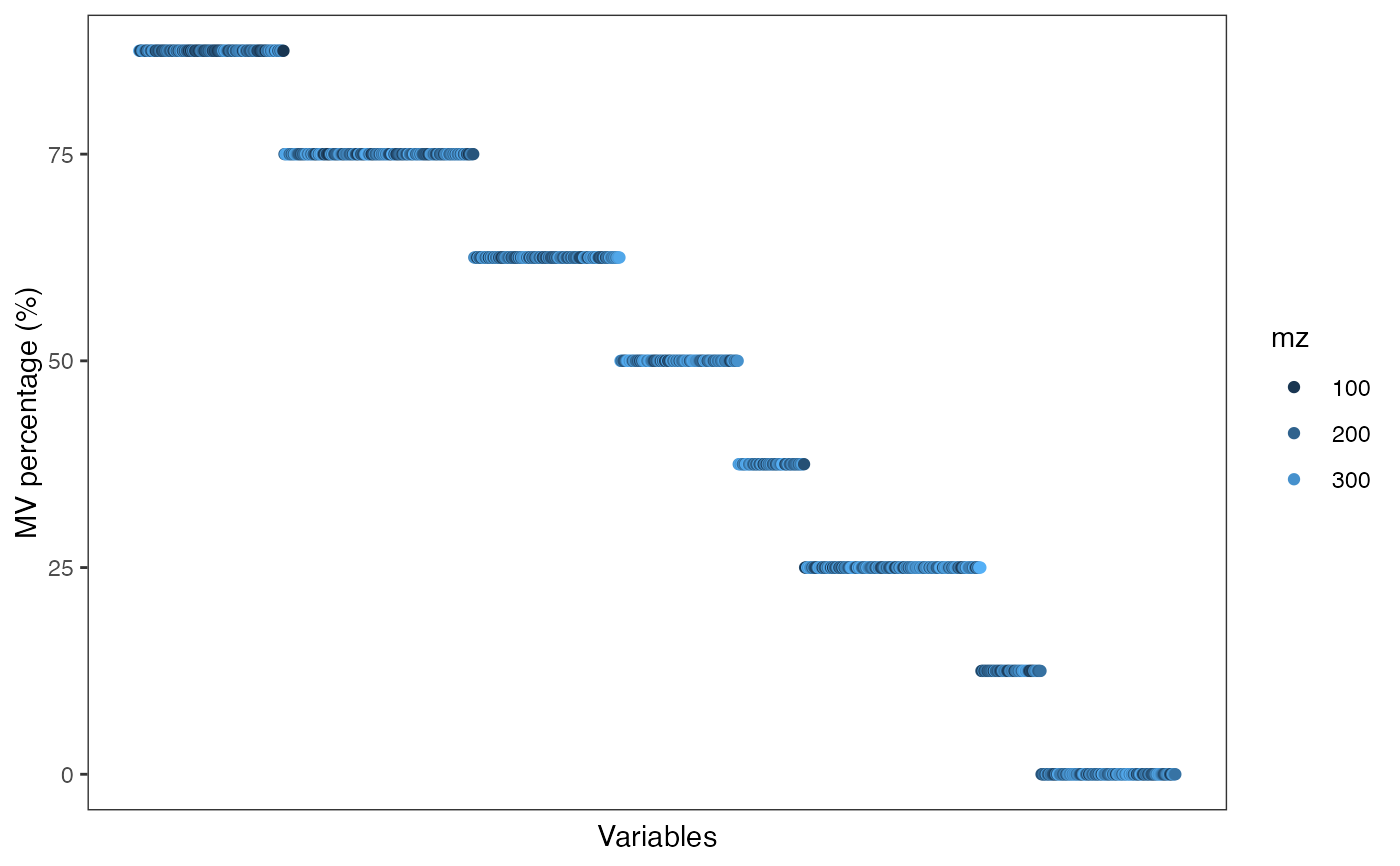
 show_variable_missing_values(object, color_by = "mz",
order_by = "na",
desc = TRUE, percentage = TRUE)
show_variable_missing_values(object, color_by = "mz",
order_by = "na",
desc = TRUE, percentage = TRUE)