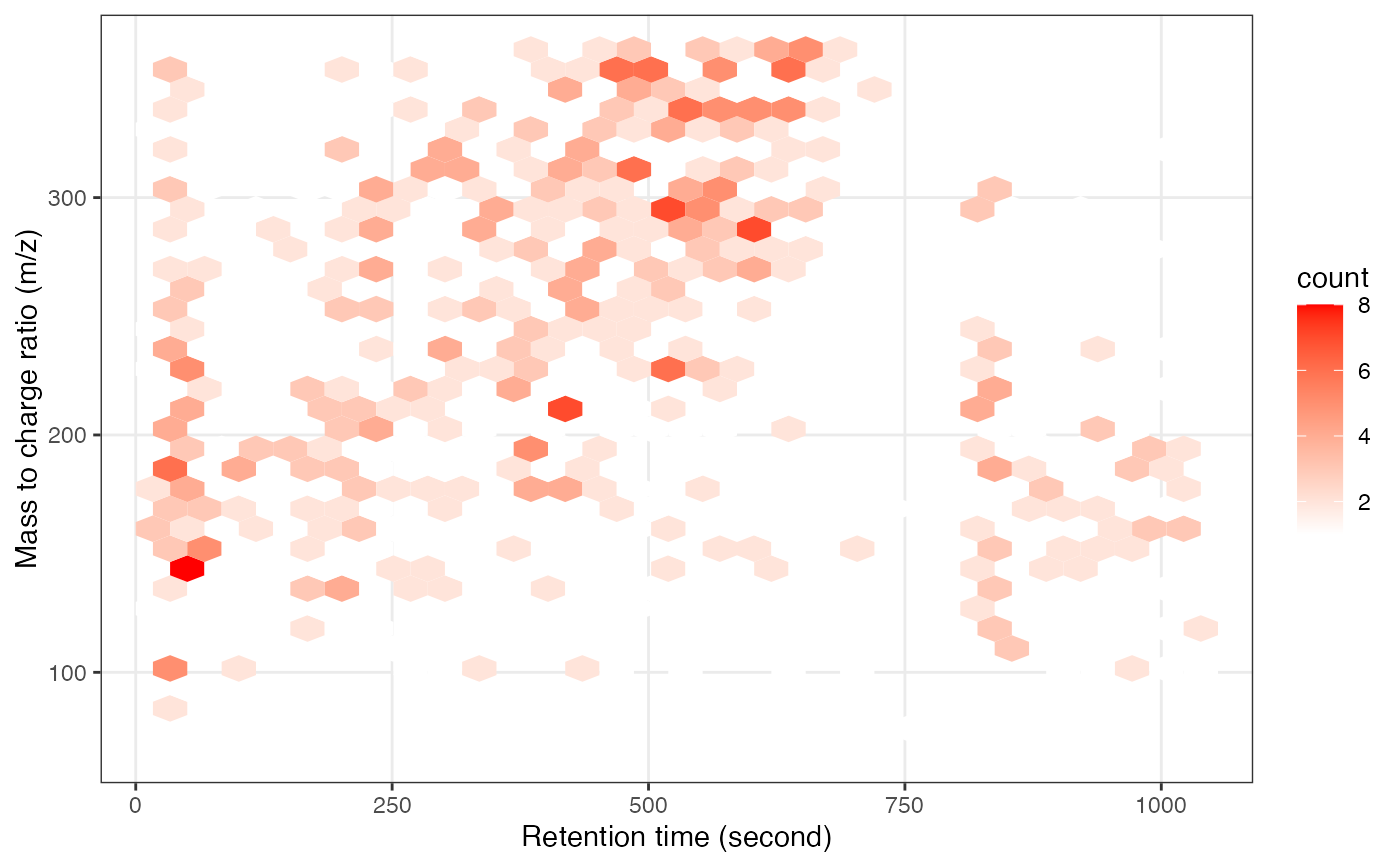
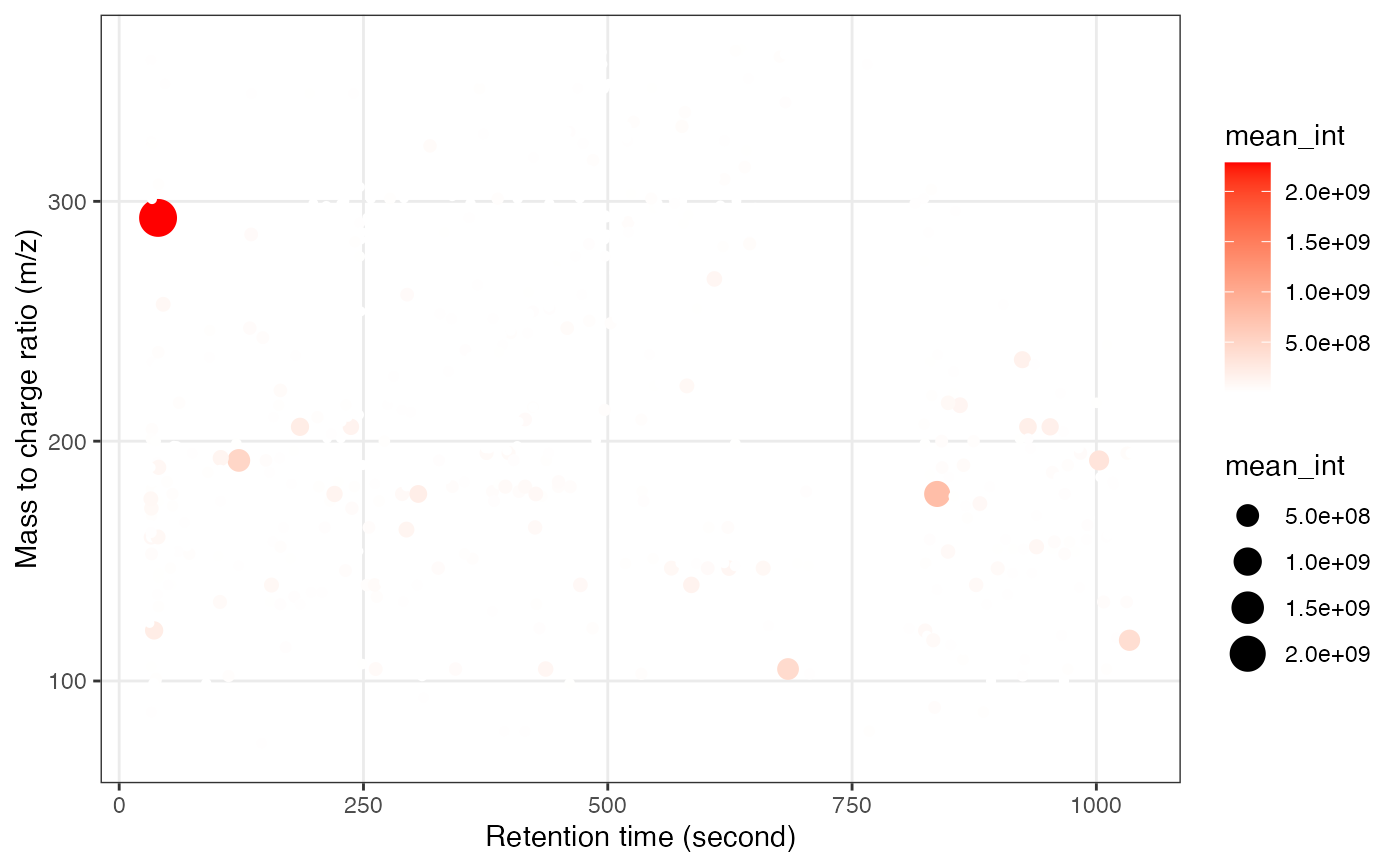
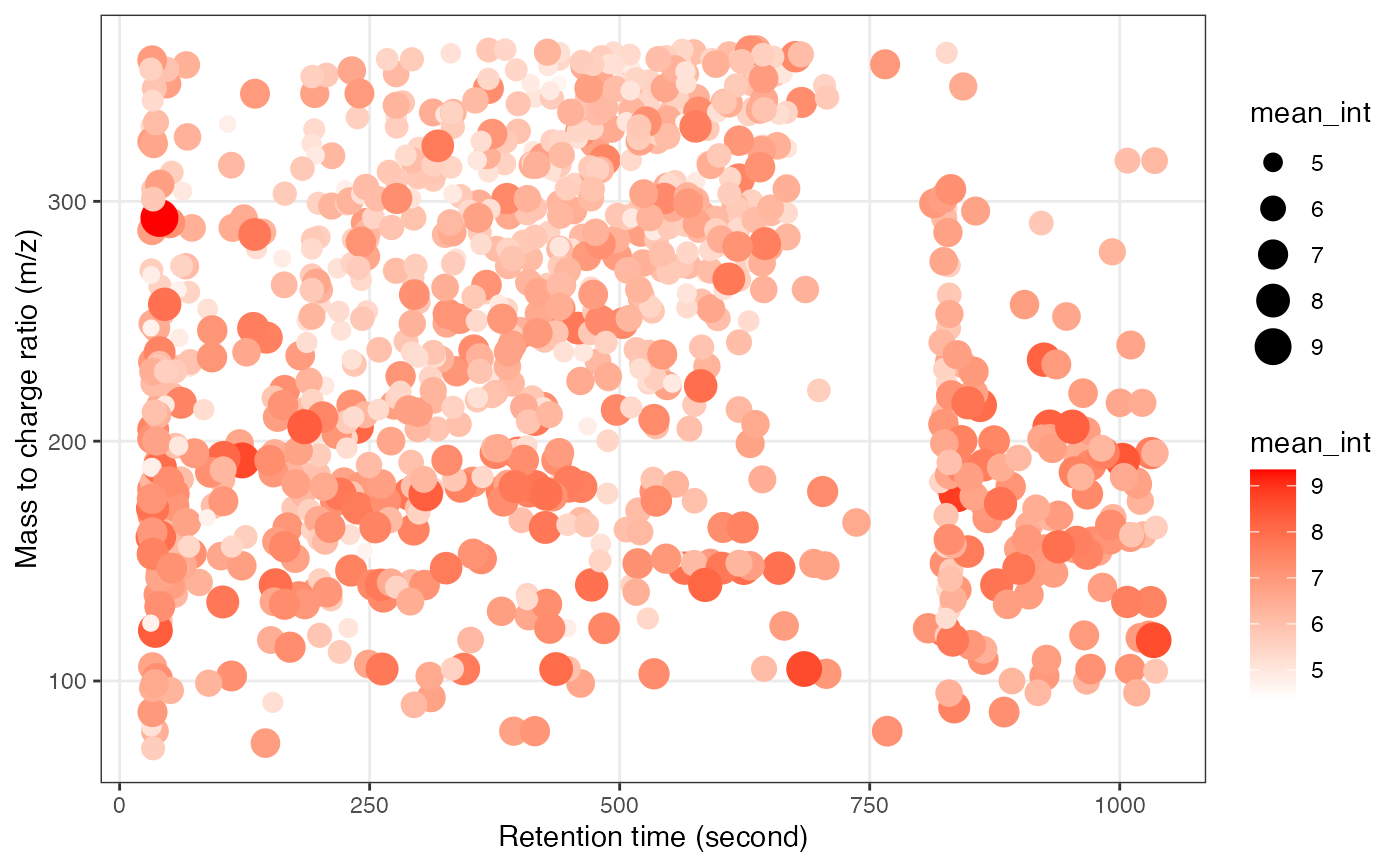
This function generates a plot of mass-to-charge ratio (m/z) against retention time (rt) for a mass_dataset object. The plot can be either a hexbin plot or a scatter plot based on the hex parameter.
Author
Xiaotao Shen xiaotao.shen@outlook.com
Examples
data("expression_data")
data("sample_info")
data("variable_info")

object <- create_mass_dataset(
  expression_data = expression_data,
  sample_info = sample_info,
  variable_info = variable_info
)

show_mz_rt_plot(object)

show_mz_rt_plot(log(object, 10))

show_mz_rt_plot(object, hex = TRUE)