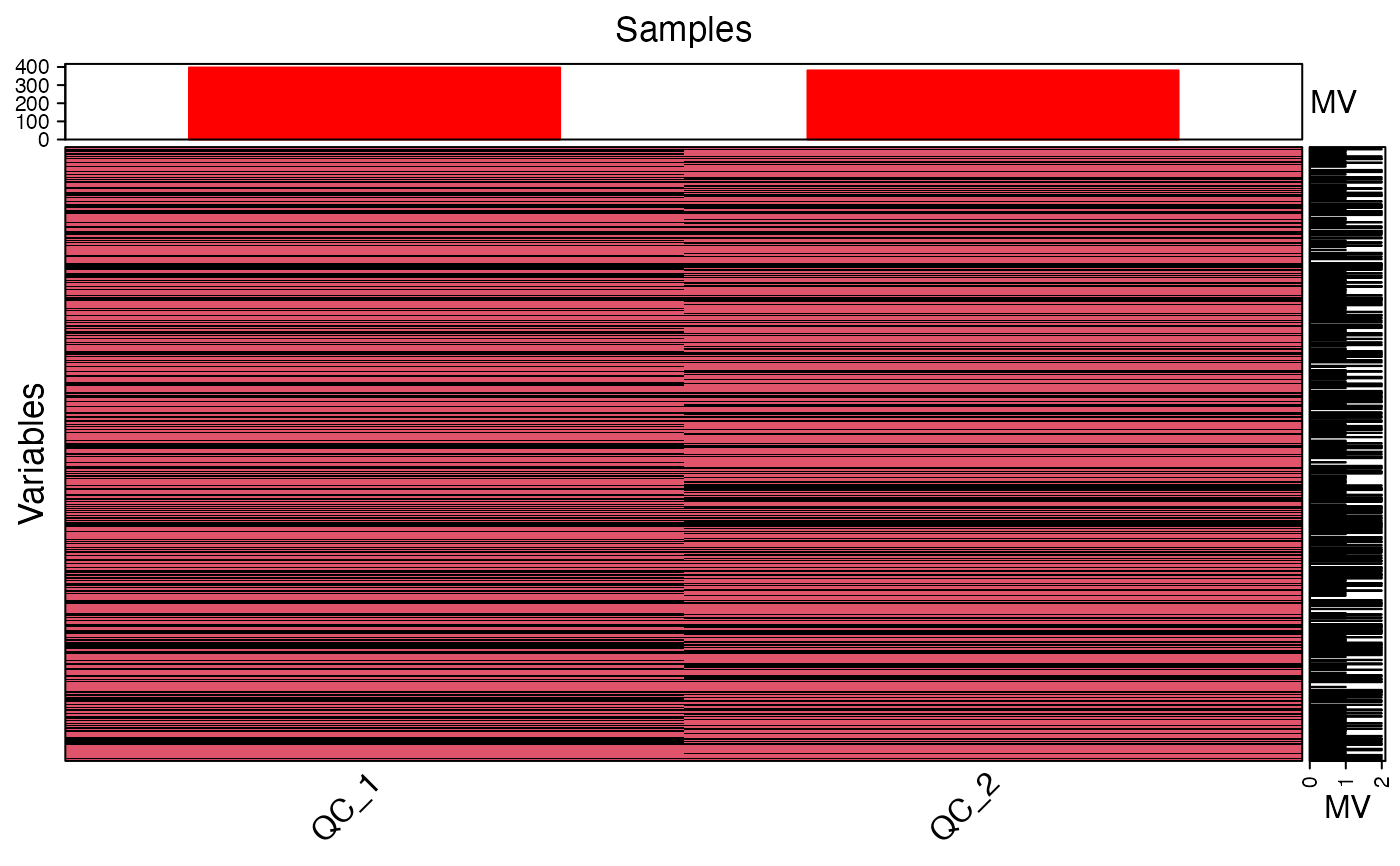
Show the missing value distributation.
Usage
show_missing_values(
  object,
  show_row_names = FALSE,
  show_column_names = TRUE,
  row_names_gp = gpar(fontsize = 12),
  column_names_gp = gpar(fontsize = 12),
  column_names_rot,
  cell_color = "transparent",
  row_names_side = "right",
  percentage = FALSE,
  sample_na_cutoff = 50,
  variable_na_cutoff = 50,
  only_outlier_samples = FALSE,
  only_outlier_variables = FALSE,
  return_as_ggplot = FALSE,
  ...
)
Arguments
- object
(required) mass_dataset class object.
- show_row_names
show row names or not. see?ComplexHeatmap::Heatmap
- show_column_names
show column names or not. see?ComplexHeatmap::Heatmap
- row_names_gp
row names gp, see?ComplexHeatmap
- column_names_gp
column names gp, see?ComplexHeatmap
- column_names_rot
column names rot see?ComplexHeatmap::Heatmap
- cell_color
Cell color.
- row_names_side
Row names side. left or right.
- percentage
percentage or not.
- sample_na_cutoff
Na cutoff for samples.
- variable_na_cutoff
Na cutoff for variables
- only_outlier_samples
Only show the outlier samples?
- only_outlier_variables
Only show the outlier variables?
- return_as_ggplot
Return plot as ggplot2 object?
- ...
Other parameters for ComplexHeatmap::Heatmap
Author
Xiaotao Shen xiaotao.shen@outlook.com
Examples
data("expression_data")
data("sample_info")
data("variable_info")
object <- create_mass_dataset(
expression_data = expression_data,
sample_info = sample_info,
variable_info = variable_info
)
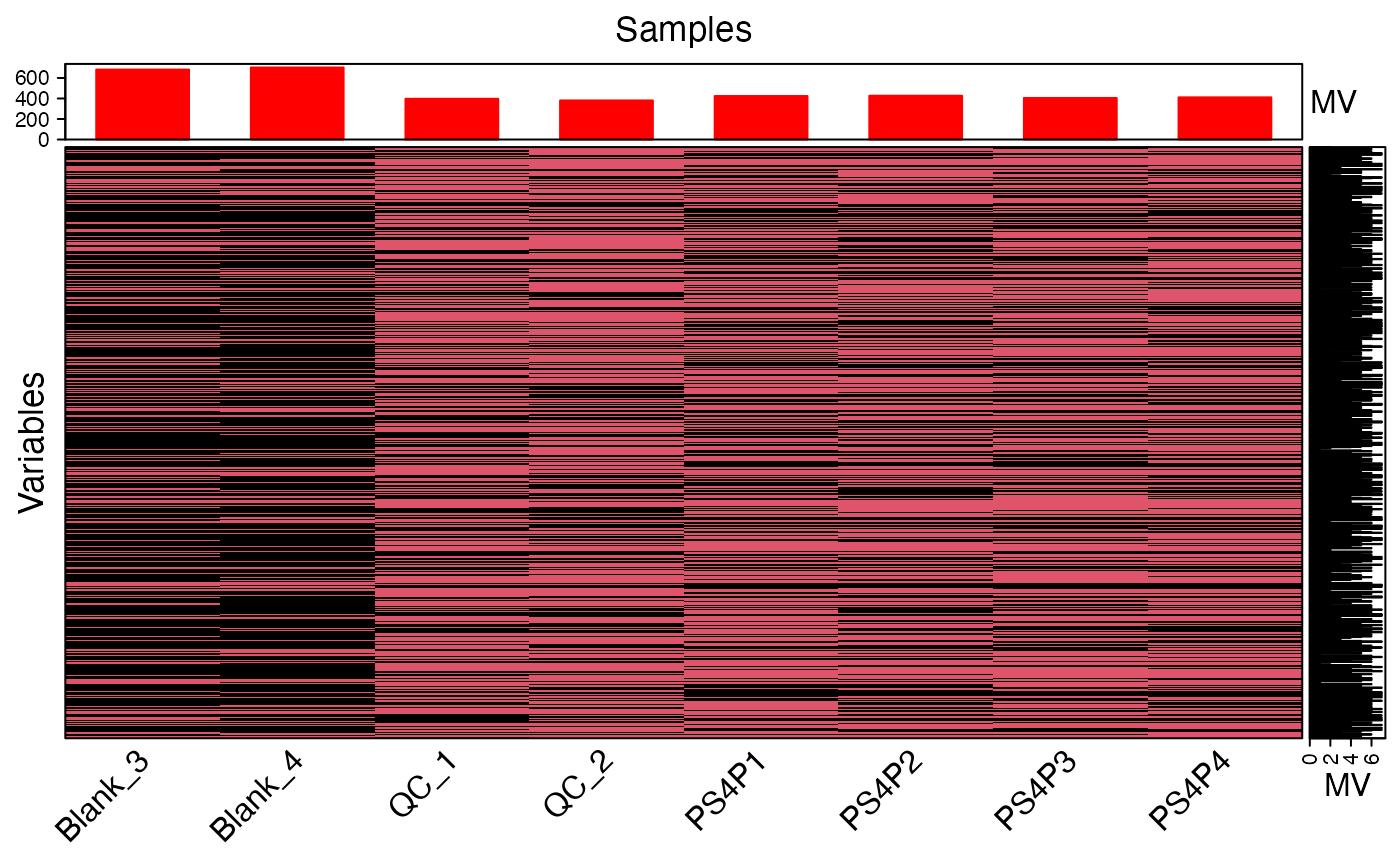
show_missing_values(object)
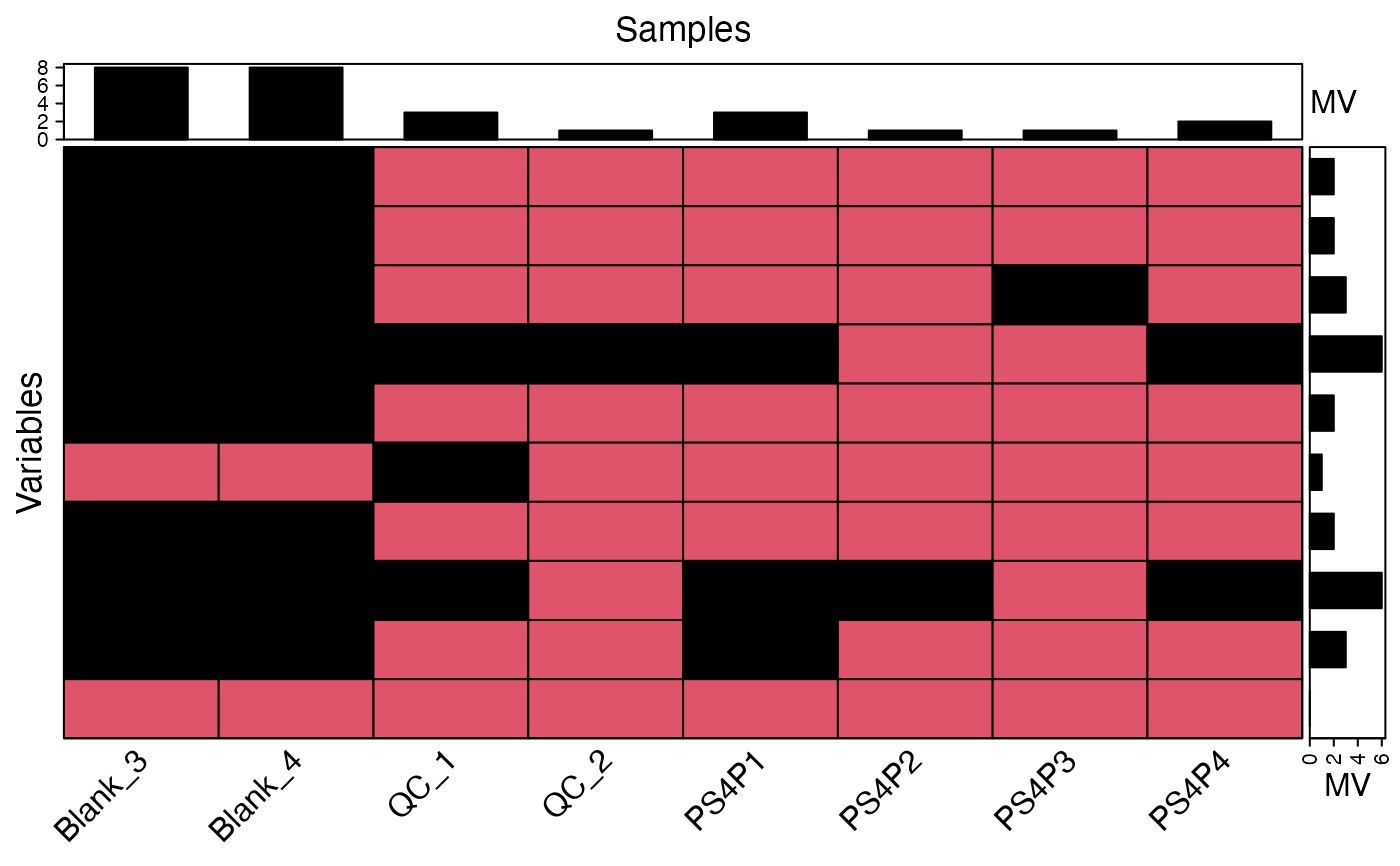
 show_missing_values(object[1:10,], cell_color = "white")
 object %>%
activate_mass_dataset(what = "sample_info") %>%
filter(class == "Subject") %>%
show_missing_values()
object %>%
activate_mass_dataset(what = "sample_info") %>%
filter(class == "Subject") %>%
show_missing_values()
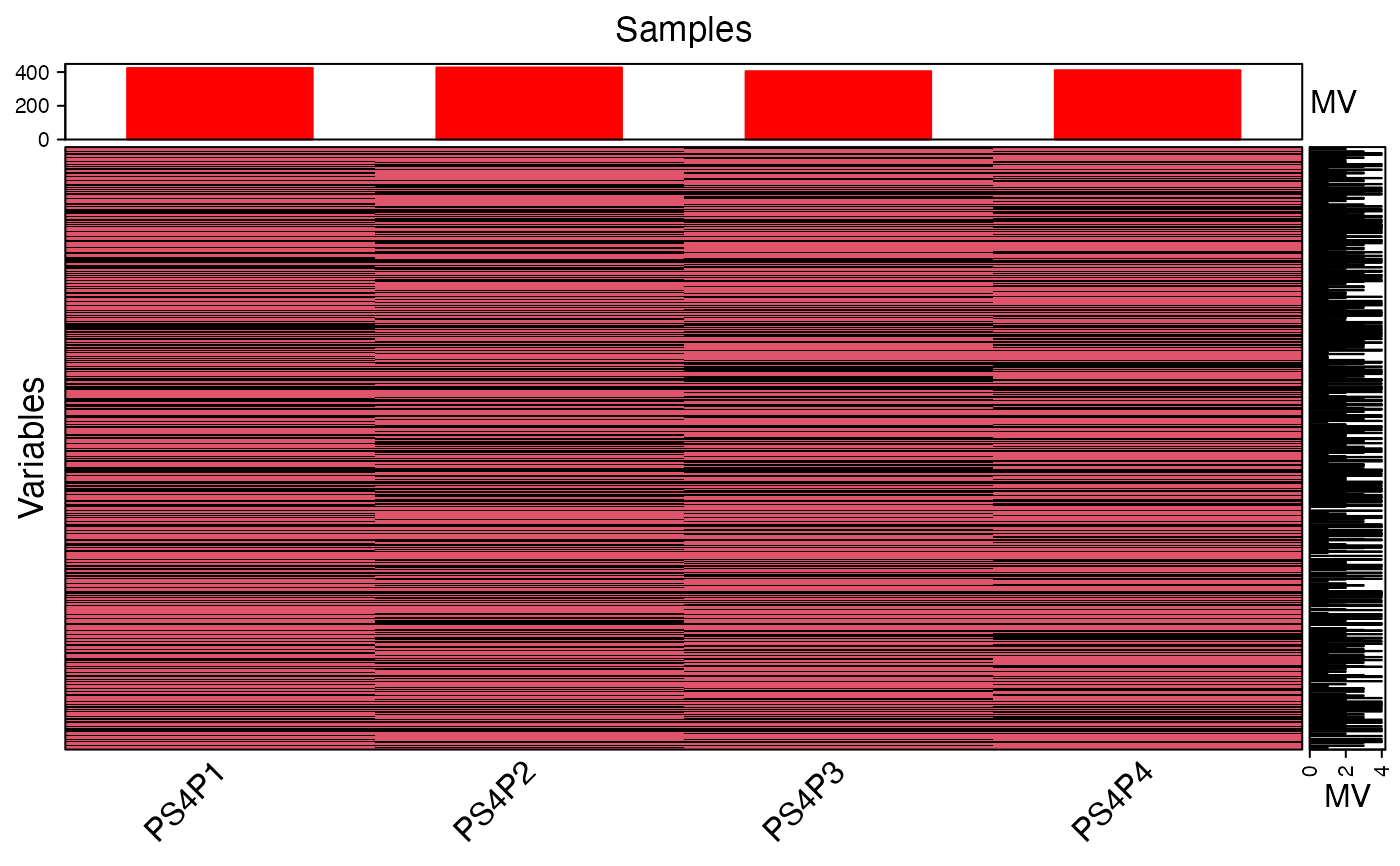 object %>%
activate_mass_dataset(what = "expression_data") %>%
dplyr::select(contains("QC")) %>%
show_missing_values()
object %>%
activate_mass_dataset(what = "expression_data") %>%
dplyr::select(contains("QC")) %>%
show_missing_values()
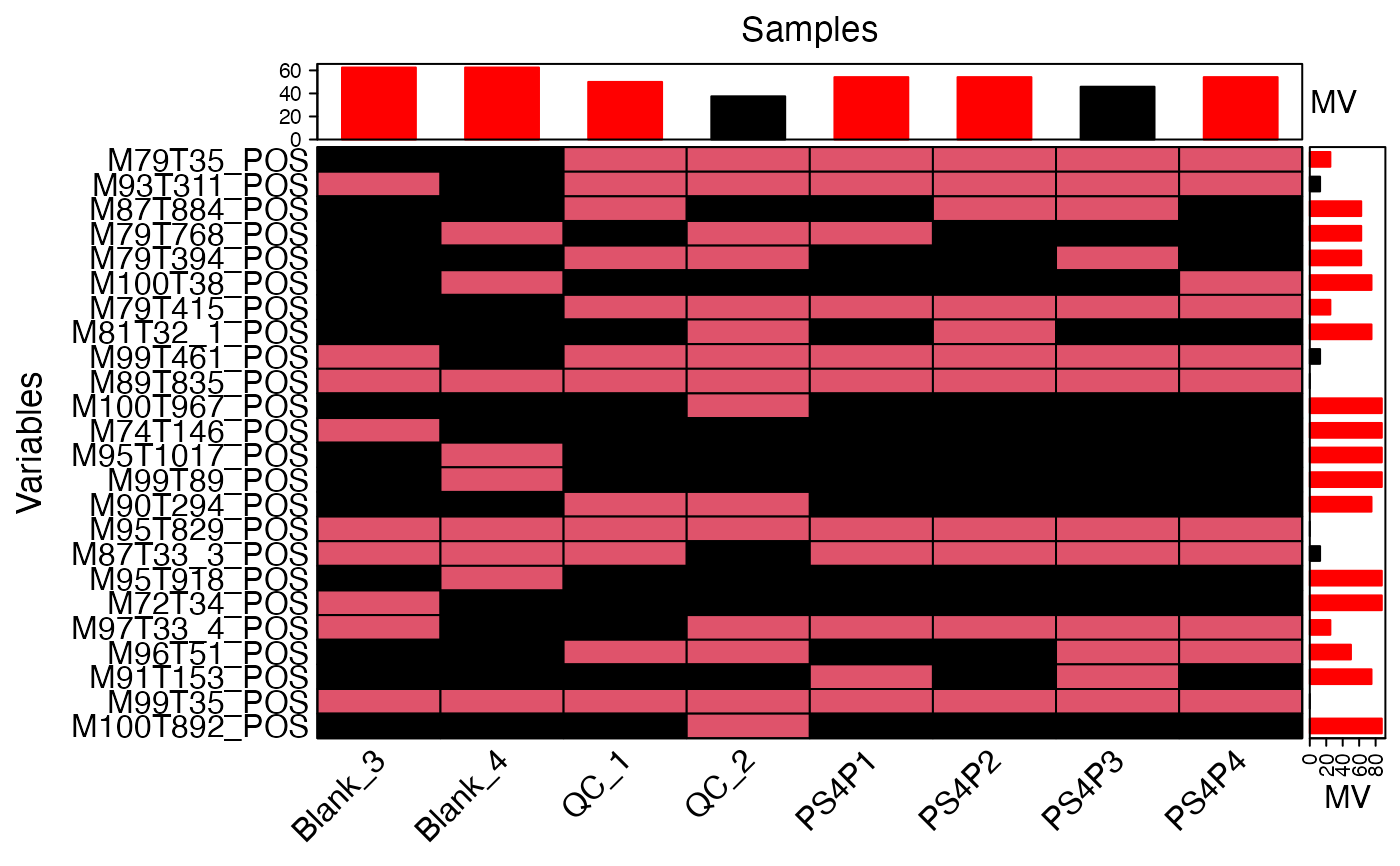
 object %>%
activate_mass_dataset(what = "variable_info") %>%
dplyr::filter(mz < 100) %>%
show_missing_values(cell_color = "white",
show_row_names = TRUE,
row_names_side = "left",
percentage = TRUE,
sample_na_cutoff = 50,
variable_na_cutoff = 20)
object %>%
activate_mass_dataset(what = "variable_info") %>%
dplyr::filter(mz < 100) %>%
show_missing_values(cell_color = "white",
show_row_names = TRUE,
row_names_side = "left",
percentage = TRUE,
sample_na_cutoff = 50,
variable_na_cutoff = 20)