Create ggplot2 Visualization for a mass_dataset Object
Source:R/ggplot_mass_dataset.R
ggplot_mass_dataset.RdThis function generates a ggplot2 visualization for a mass_dataset object. You can choose the direction of the visualization (either "variable" or "sample"), specify the variable or sample of interest, and create various plots based on the chosen direction and data.
Usage
ggplot_mass_dataset(
  object,
  direction = c("variable", "sample"),
  variable_index = 1,
  variable_id,
  sample_index = 1,
  sample_id
)
Arguments
- object
A mass_dataset object.
- direction
A character vector specifying the direction of the visualization. It can be either "variable" or "sample". Default is "variable".
- variable_index
An integer specifying the index of the variable of interest. If not provided, you can use 'variable_id' to specify the variable by its ID.
- variable_id
A character string specifying the ID of the variable of interest. If provided, 'variable_index' will be ignored.
- sample_index
An integer specifying the index of the sample of interest. If not provided, you can use 'sample_id' to specify the sample by its ID.
- sample_id
A character string specifying the ID of the sample of interest. If provided, 'sample_index' will be ignored.
Author
Xiaotao Shen xiaotao.shen@outlook.com
Examples
data("expression_data")
data("sample_info")
data("variable_info")
object <- create_mass_dataset(
expression_data = expression_data,
variable_info = variable_info,
sample_info = sample_info
)
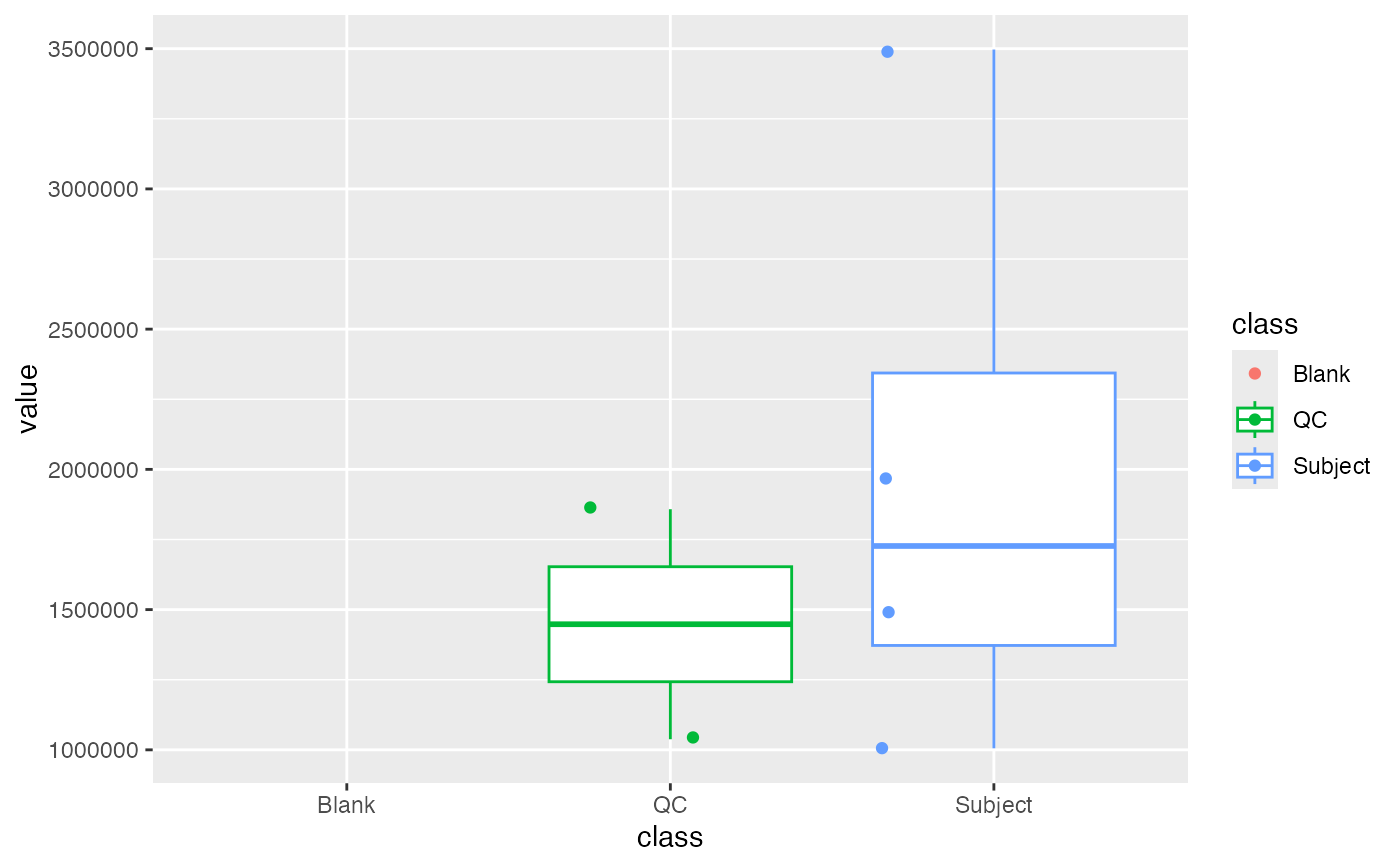
ggplot_mass_dataset(object, direction = "variable", variable_index = 1) +
ggplot2::geom_boxplot(ggplot2::aes(x = class, color = class)) +
ggplot2::geom_jitter(ggplot2::aes(x = class, color = class))
 object %>%
`+`(1) %>%
log(10) %>%
scale() %>%
ggplot_mass_dataset(direction = "sample", sample_index = 2) +
ggplot2::geom_boxplot(ggplot2::aes(x = 1)) +
ggplot2::geom_jitter(ggplot2::aes(x = 1, color = mz))
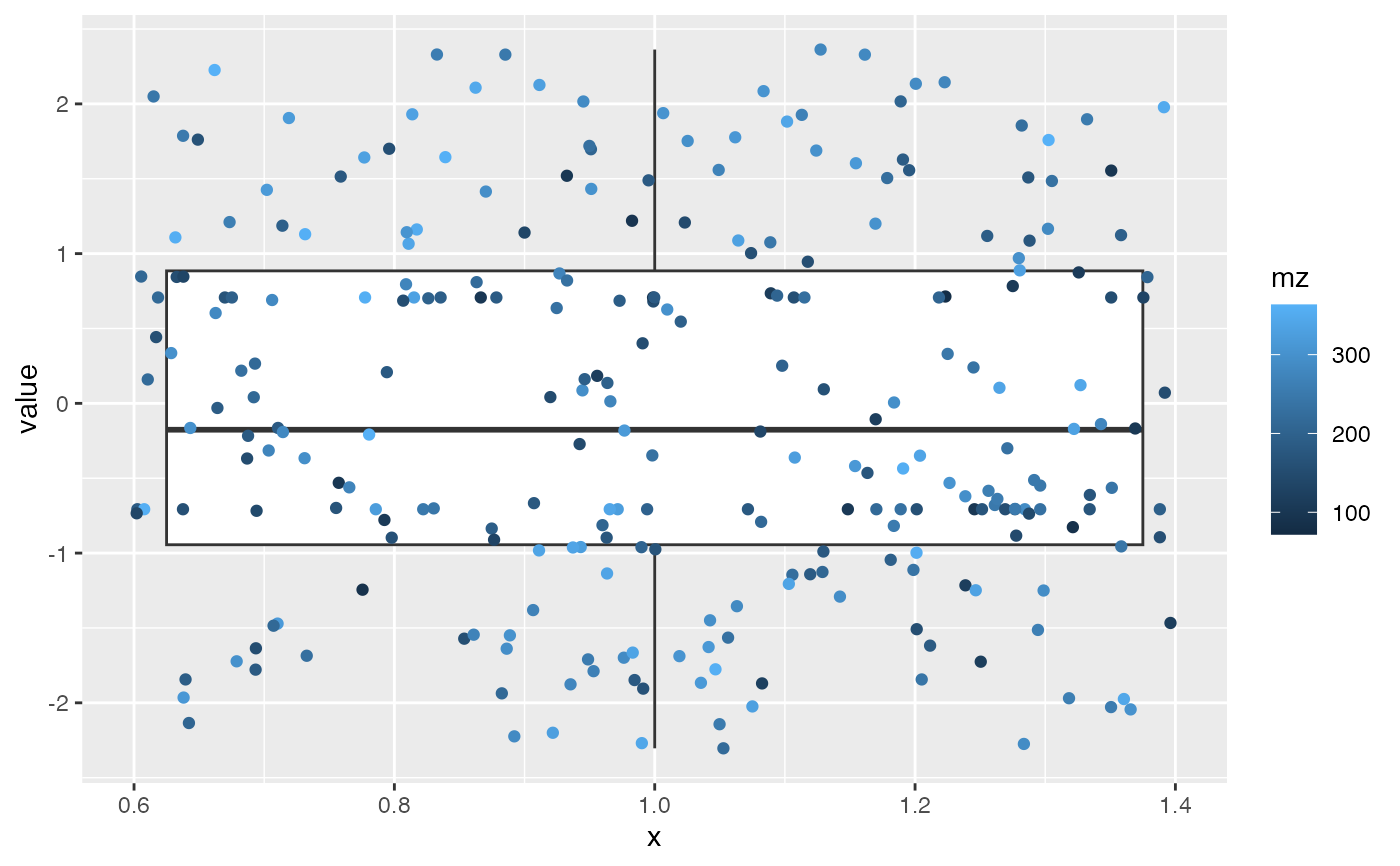
object %>%
`+`(1) %>%
log(10) %>%
scale() %>%
ggplot_mass_dataset(direction = "sample", sample_index = 2) +
ggplot2::geom_boxplot(ggplot2::aes(x = 1)) +
ggplot2::geom_jitter(ggplot2::aes(x = 1, color = mz))