9 Feature Annotation
This chapter focuses on how to use Step 2: Feature Annotation in FeatureMAP Shiny. The detailed method, parameter definitions, and output structure have already been introduced in R package-Feature Annotation, so here we focus on the app workflow itself.
Prerequisites: Make sure your data have been loaded successfully in Data Upload before starting this step.
9.1 Enter the Feature Annotation Page
After finishing Data Upload, click Next Step, or open Analysis → 2 Feature Annotation in the navigation bar.
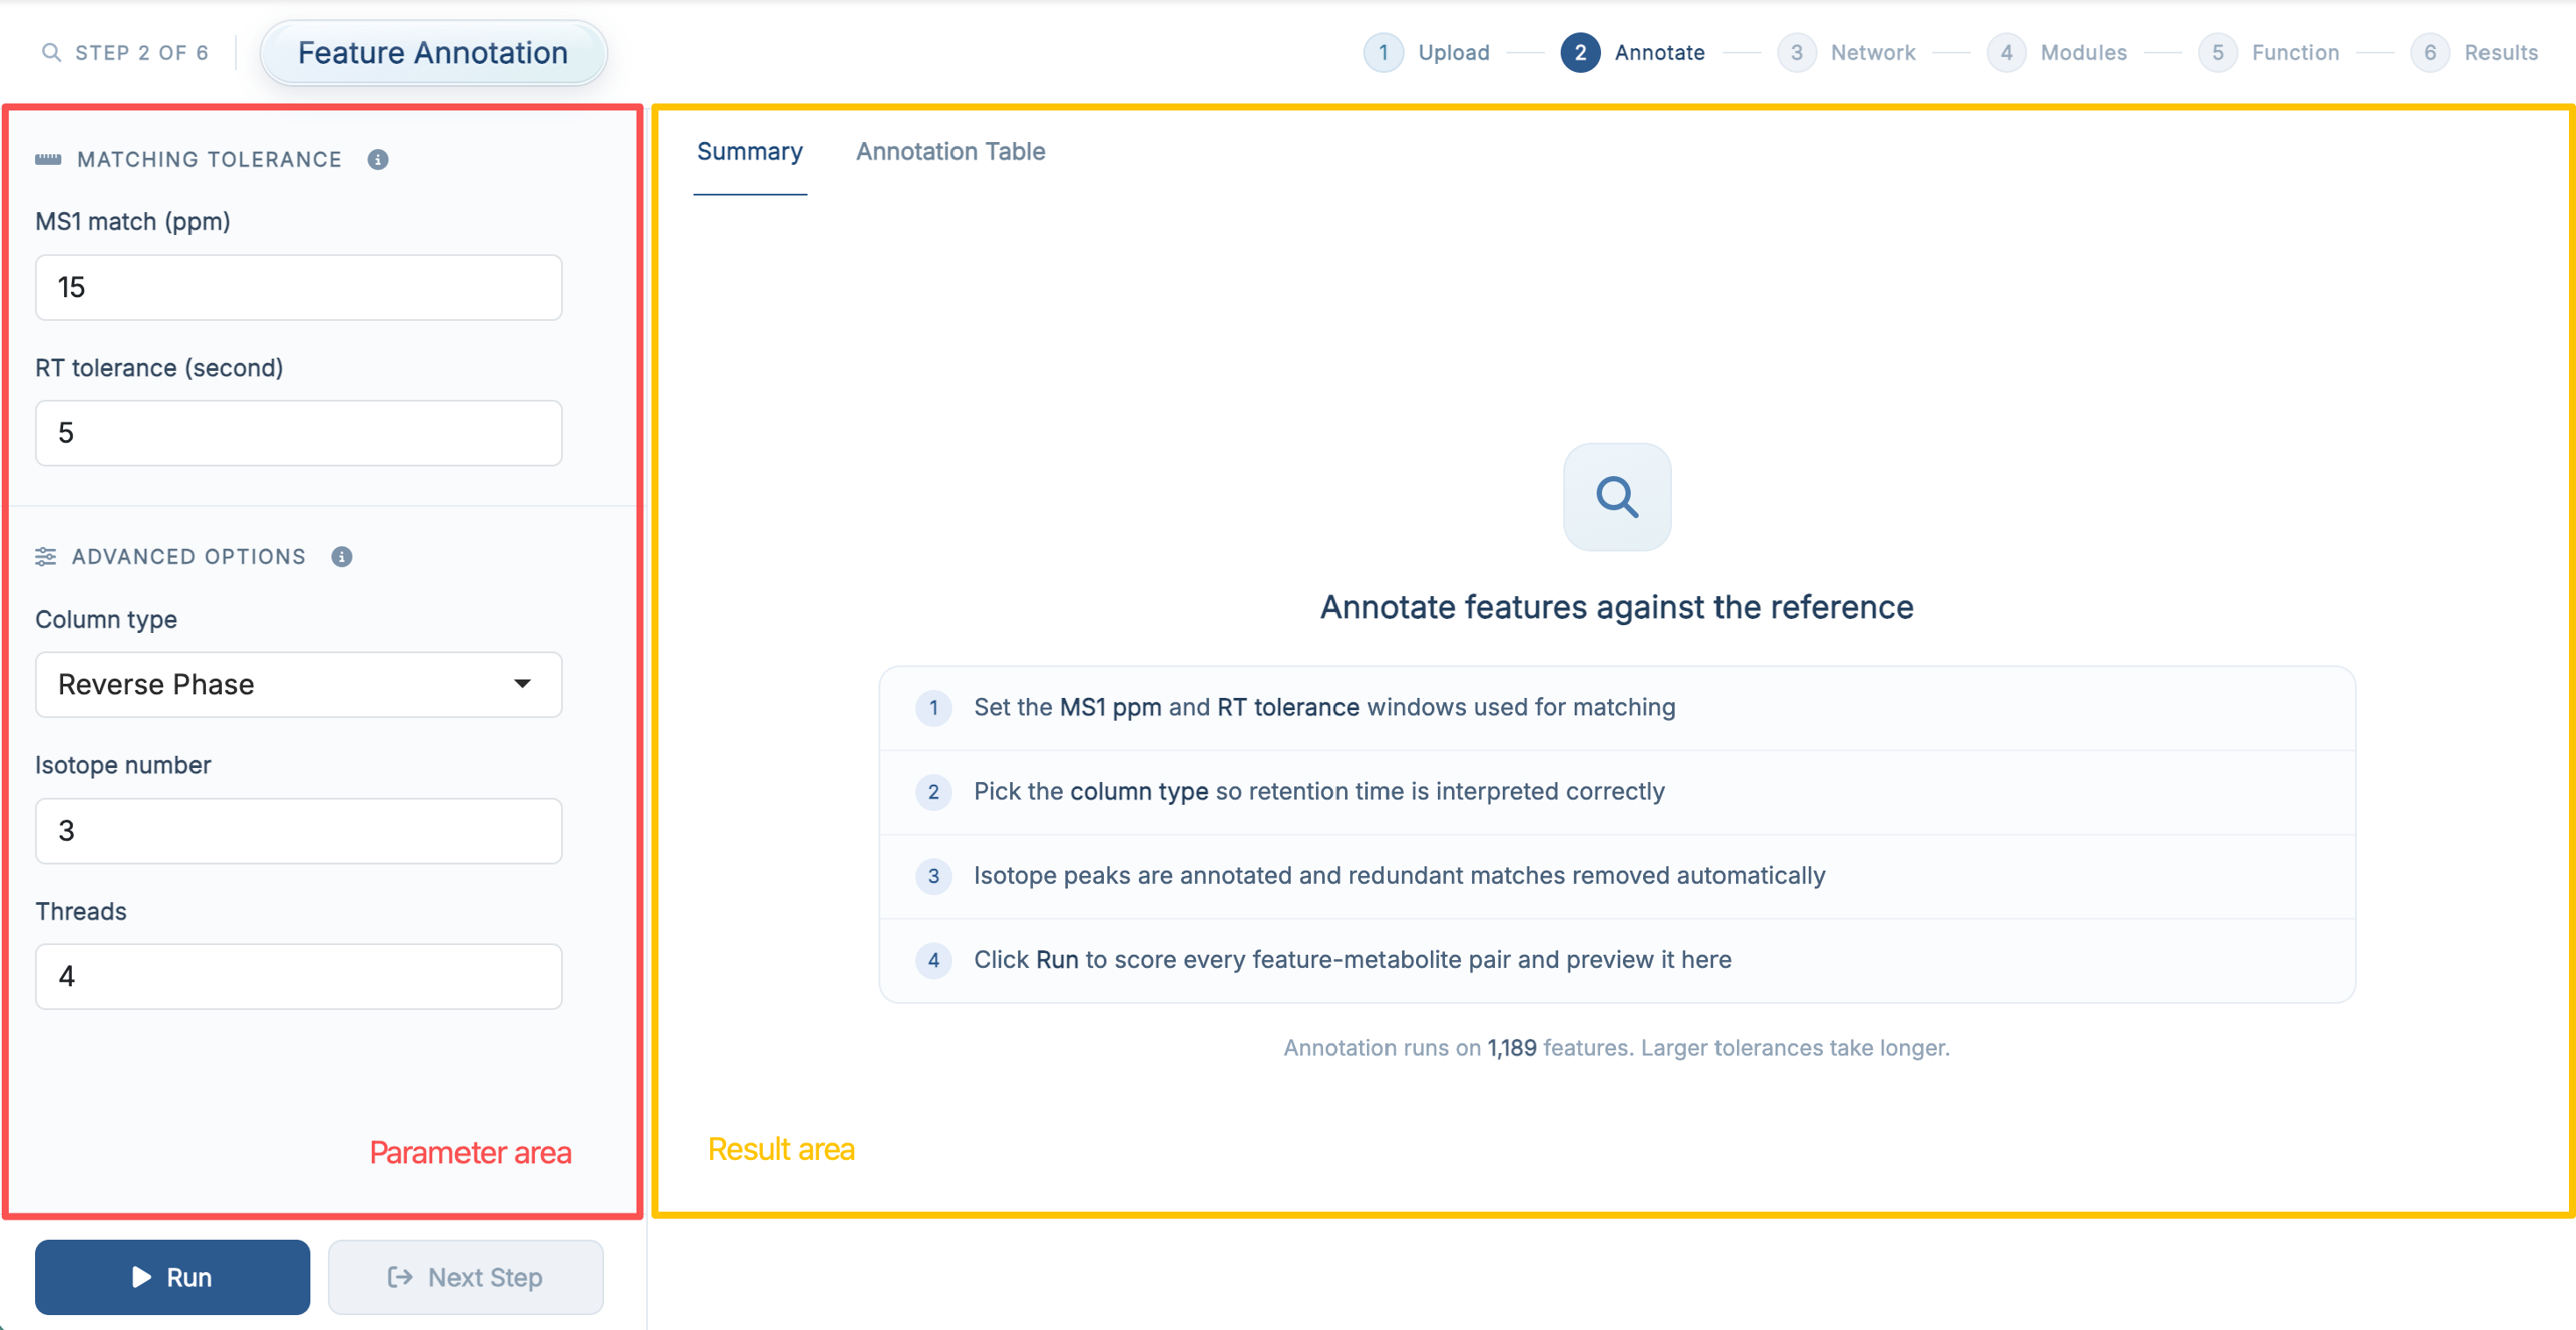
The purpose of this step is to map metabolomics features to candidate metabolites and prepare the refined annotation table for downstream network analysis.
9.2 Parameter Area
The left panel groups the annotation parameters into two sections:
| Section | Field | Default |
|---|---|---|
| Matching Tolerance | MS1 match (ppm) | 15 |
| RT tolerance (second) | 5 |
|
| Advanced Options | Column type (Reverse Phase / HILIC) | Reverse Phase |
| Isotope number | 3 |
|
| Threads | 4 |
The meaning of each parameter is the same as in R package-Feature Annotation, and the ⓘ icon next to each section title repeats the short version inside the app.
If you are running the demo data for the first time, it is usually best to keep the default settings and run the step once before tuning anything.
9.3 Run Feature Annotation
Once the parameters are ready, click Run.
A progress card appears while the step is running. When it finishes, the card reports:
- Annotated features – how many of the uploaded features received at least one candidate, with the percentage
- Feature-metabolite pairs – how many annotation rows were produced
The result panel on the right is updated automatically and the Next Step button becomes available.
If you did not provide an MS2 annotation table in the previous step, the app will still run using MS1-based annotation only.
9.4 Result Area
9.4.1 Summary
The Summary tab reports how much annotation ambiguity was removed by the refinement stage, comparing the state before and after filtering along two axes:
- Candidate metabolites per feature – how many metabolites a single feature is still assigned to
- Feature groups per metabolite – how many metabolite feature clusters (MFCs) point at the same metabolite
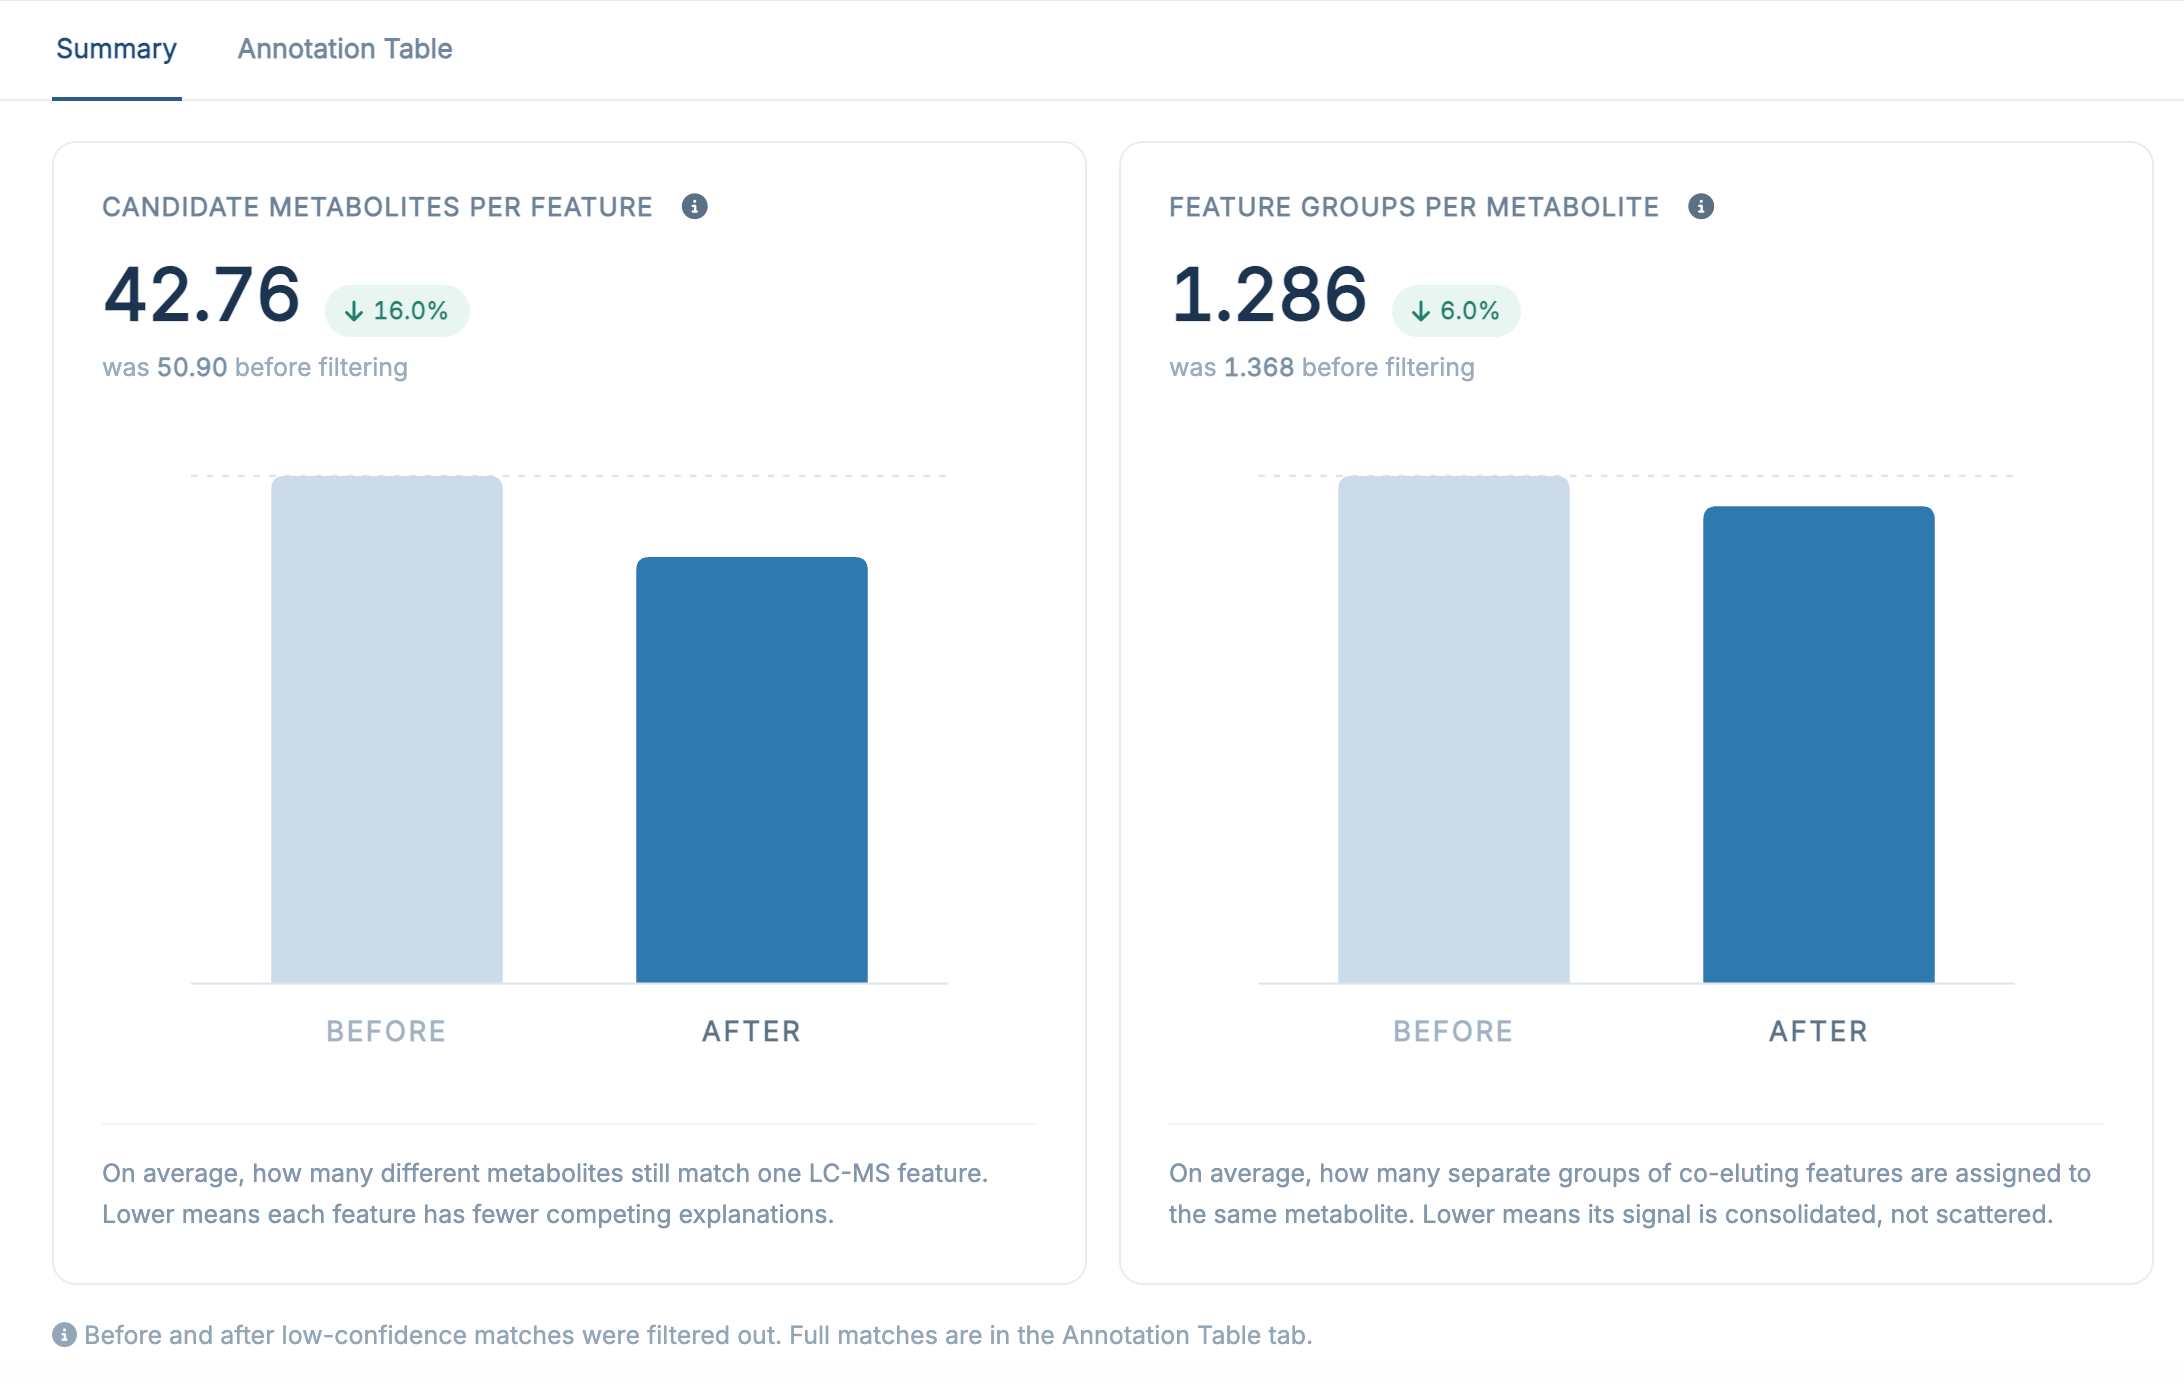
This view is useful for checking whether the annotation step completed normally and whether the refinement reduced redundancy.
9.4.2 Annotation Table
The Annotation Table tab contains the detailed feature-to-metabolite annotation results produced by this step; it is the same table as res$anno_feature_table1 in the R package.
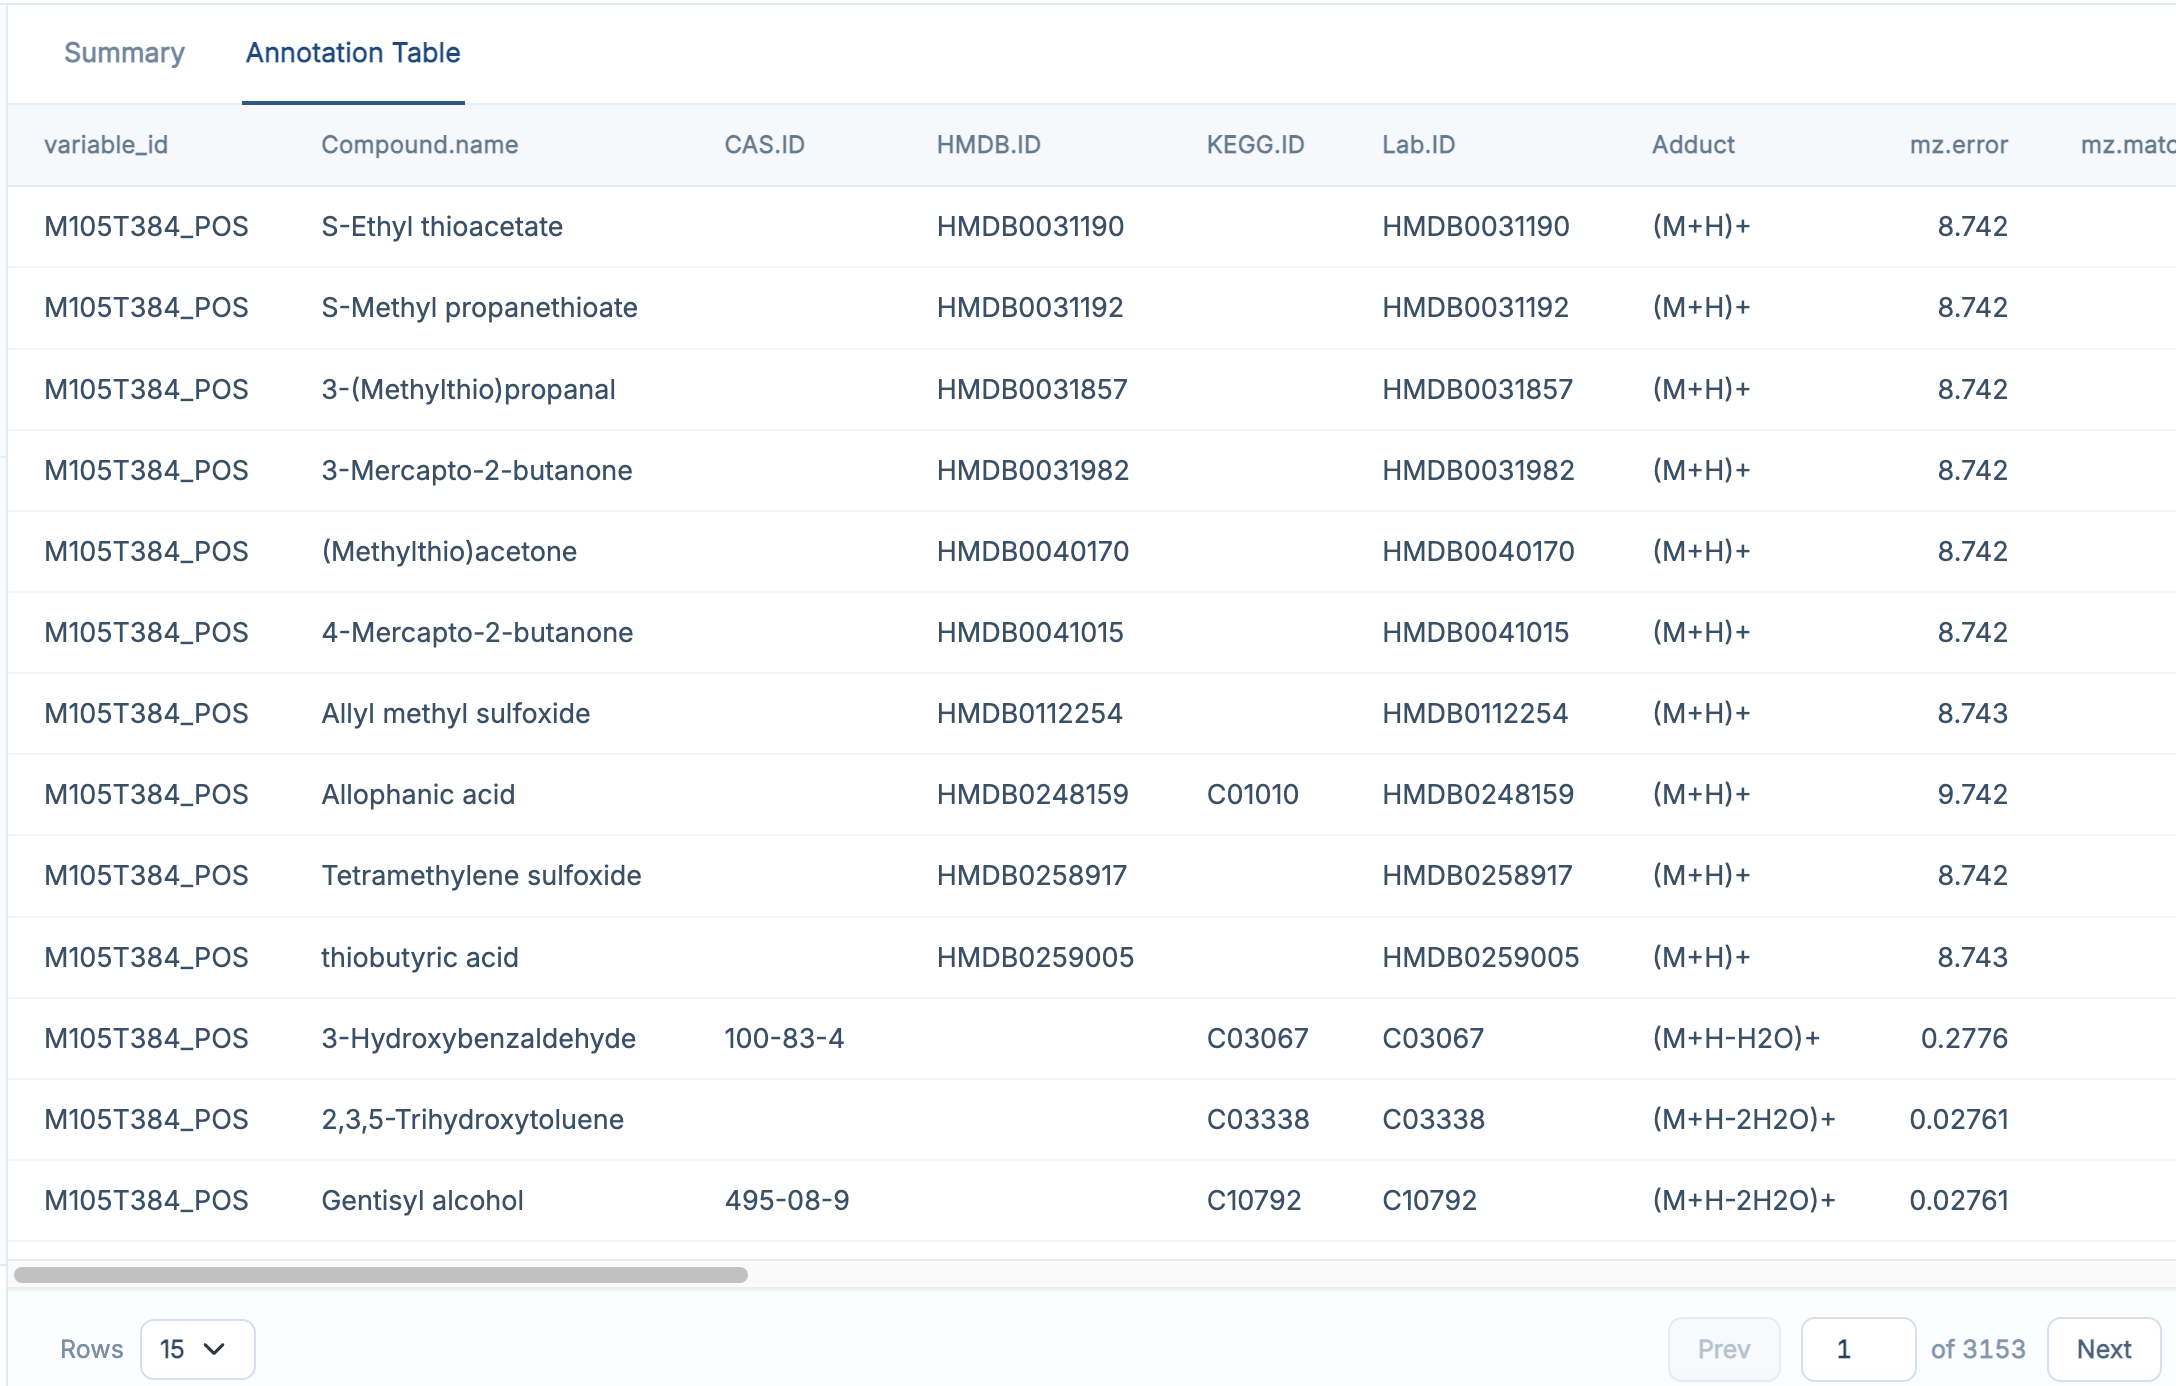
For a full explanation of the result columns, see R package-Feature Annotation. The table supports searching, sorting, and column filtering directly in the browser.
9.5 Recommended: Run the Demo Data First
If you followed the previous chapter and loaded the built-in demo data, the recommended workflow here is:
- keep the default parameter settings
- click Run
- wait for the annotation step to finish
- check the Summary tab first
- then open Annotation Table to inspect the detailed annotation results
This is the easiest way to understand what the step produces before applying it to your own dataset.
If the result table looks empty, first check whether Data Upload finished successfully in the previous step, and then confirm that the input files were loaded correctly.
9.6 Next Step
Once feature annotation is complete, click Next Step to continue to PCSF Subnetwork.