3 featureMSEA Analysis
Step 2 performs feature rank-based metabolite set enrichment scoring. Features are ranked according to a user-provided phenotype-associated statistic, and for each metabolite set, a running enrichment score is computed across the ranked feature list to evaluate whether features annotated to metabolites in that set are non-randomly concentrated toward the top of the ranking.
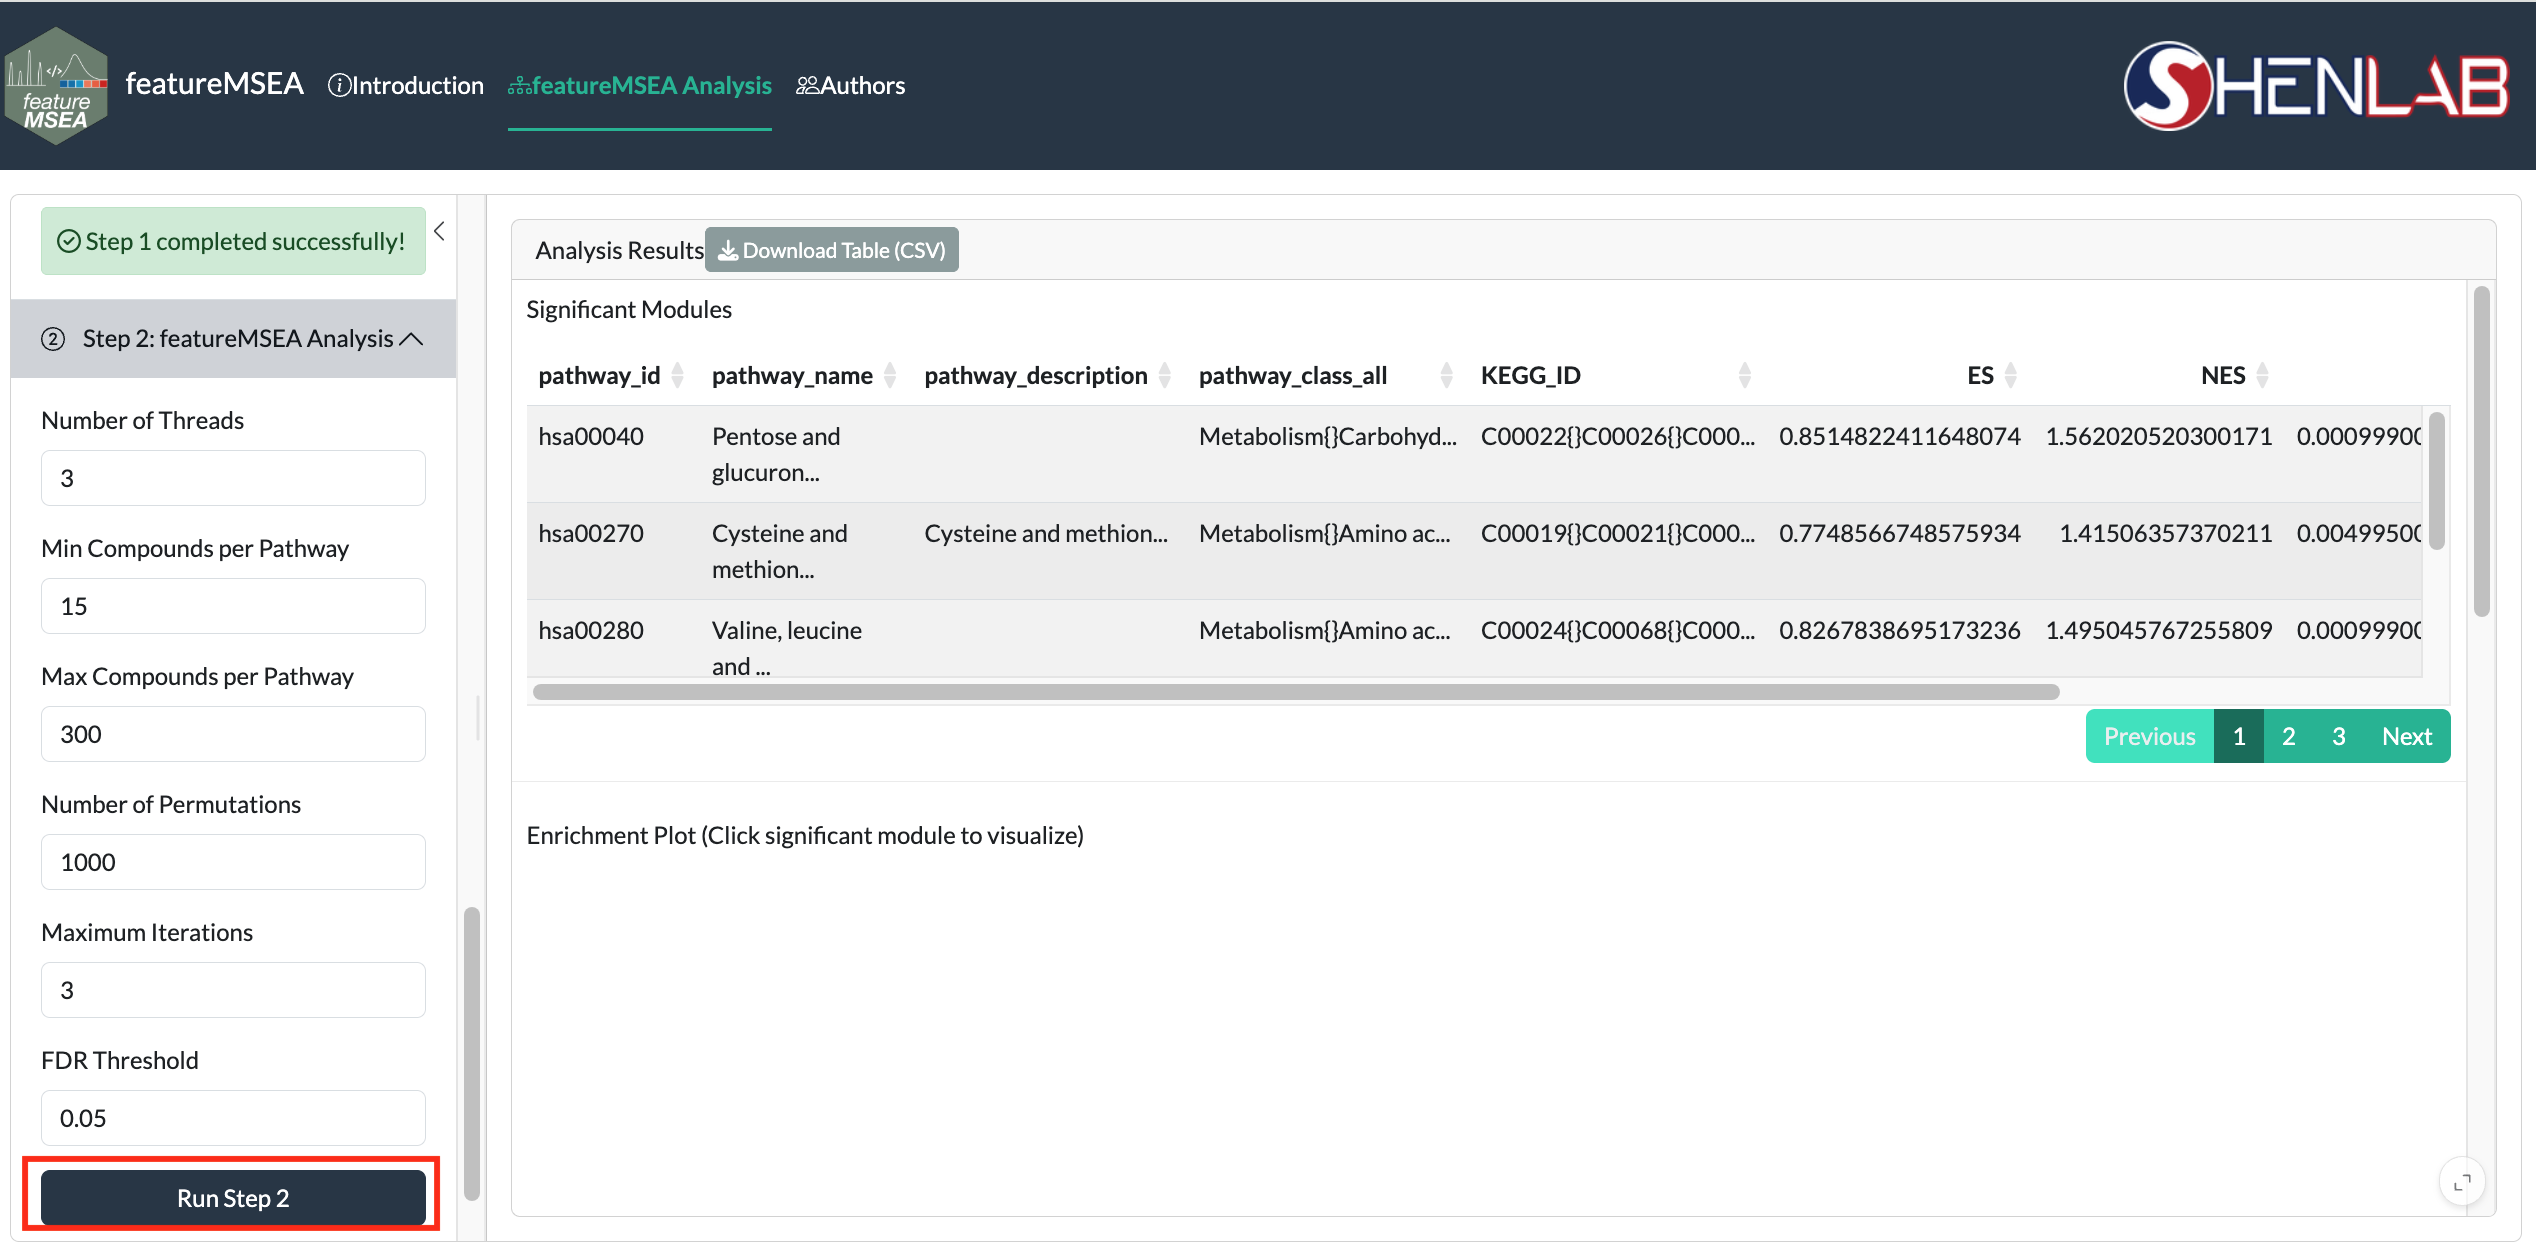
Figure 3.1: Step 2: featureMSEA enrichment parameters
3.1 Parameters
| Parameter | Description | Default |
|---|---|---|
Threads |
Parallel processing threads | 3 |
Min Compounds |
Minimum pathway size (compounds) | 15 |
Max Compounds |
Maximum pathway size (compounds) | 300 |
Permutations |
Statistical permutations for p-value estimation | 1000 |
Max Iterations |
Algorithm iterations | 1 |
FDR Thr |
FDR significance threshold | 0.05 |
Note: Increasing
Permutationsimproves p-value precision but increases runtime proportionally.1000permutations gives a good balance for exploratory analysis; use10,000+ for publication-quality results.
Click Run Step 2. Run time scales with the number of permutations and the size of the pathway database. A progress bar is shown during computation.