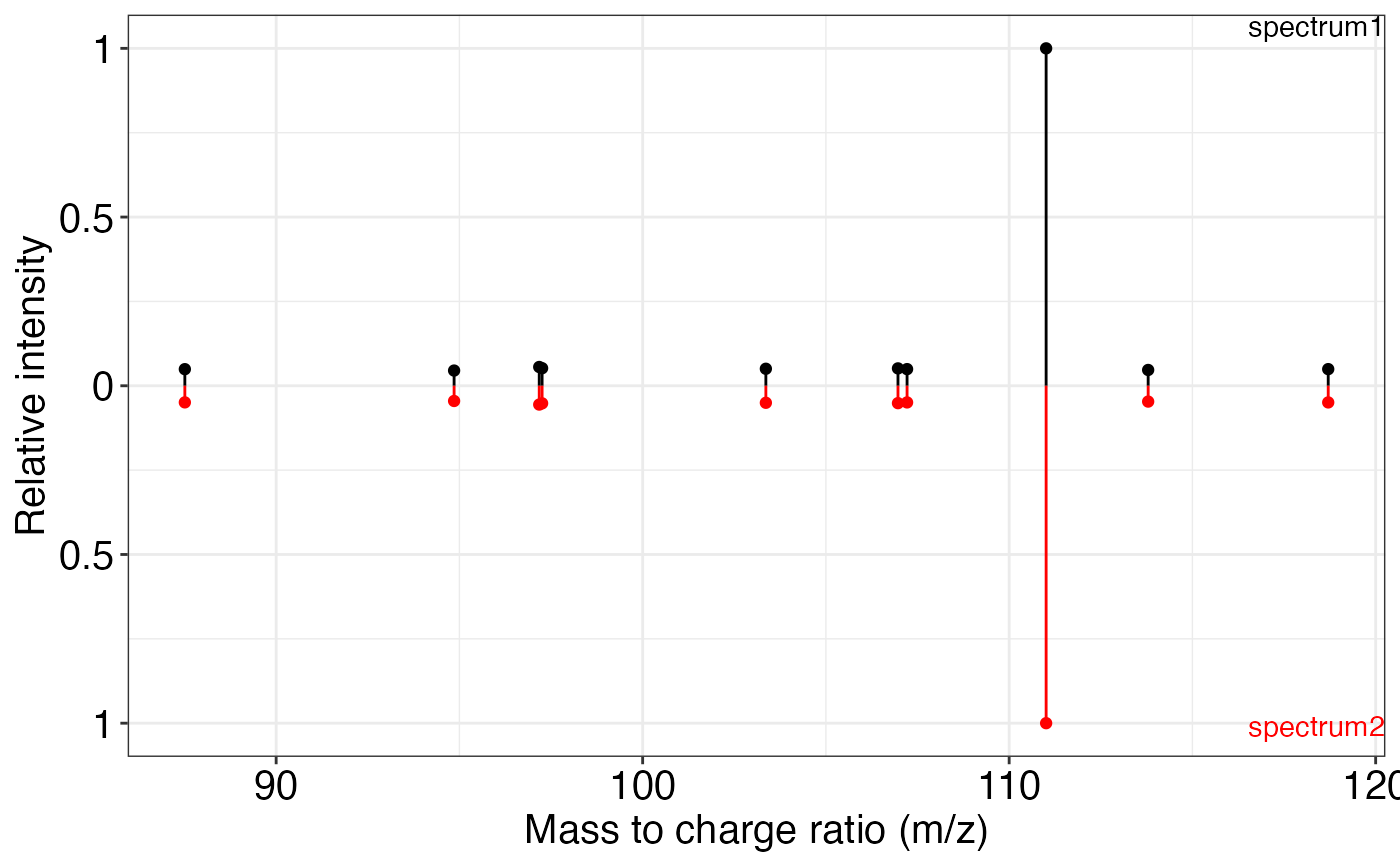
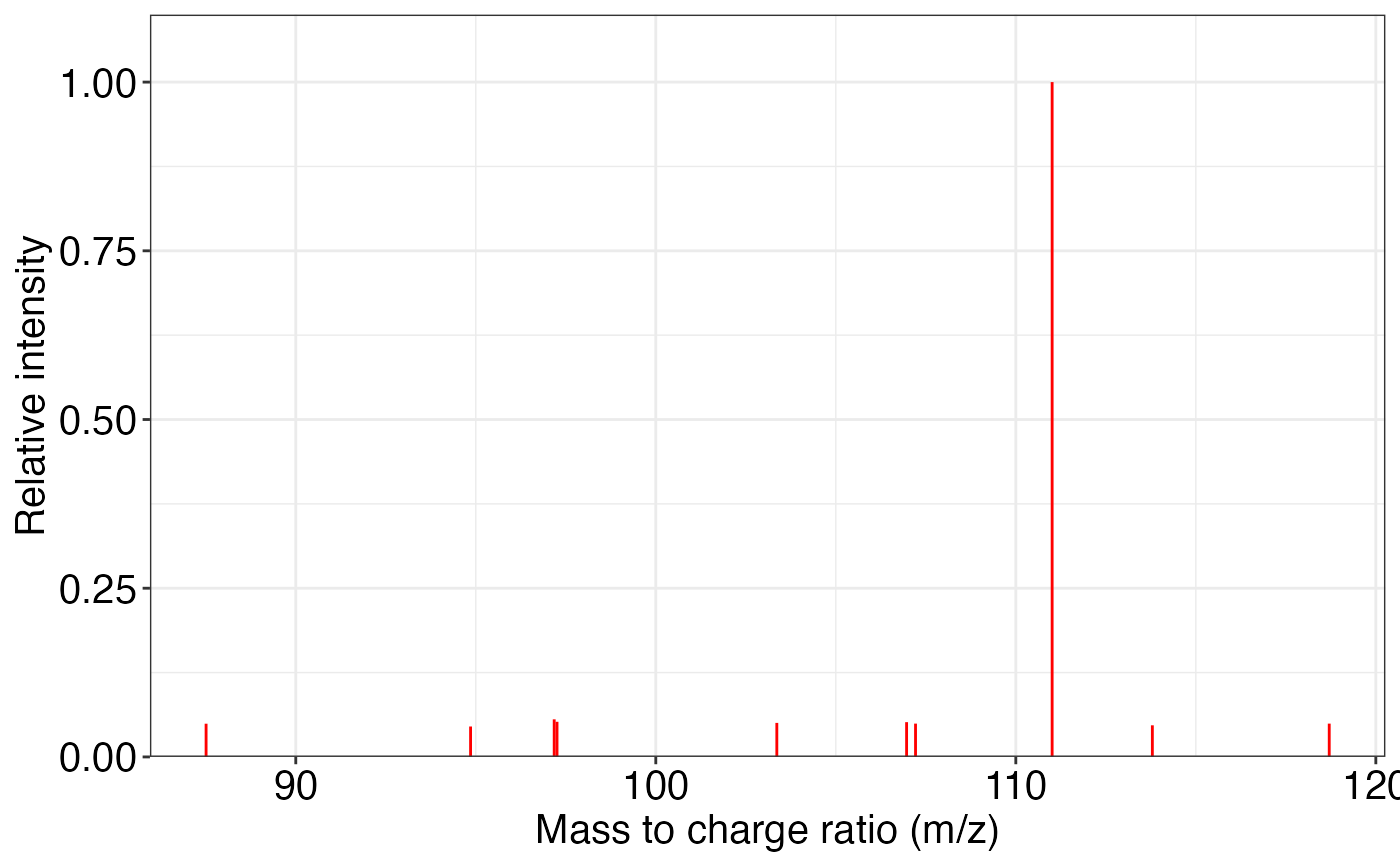
Plot ms2 spectra or ms2 match plot.
ms2_plot(
  spectrum1,
  spectrum2,
  spectrum1_name = "spectrum1",
  spectrum2_name = "spectrum2",
  range.mz,
  ppm.tol = 30,
  mz.ppm.thr = 400,
  xlab = "Mass to charge ratio (m/z)",
  ylab = "Relative intensity",
  col1 = "red",
  col2 = "black",
  title.size = 15,
  lab.size = 15,
  axis.text.size = 15,
  legend.title.size = 15,
  legend.text.size = 15,
  interactive_plot = FALSE
)
Arguments
- spectrum1
Spectrum 1.
- spectrum2
Spectrum 2.
- spectrum1_name
Name of spectrum1
- spectrum2_name
Name of spectrum2
- range.mz
range.mz
- ppm.tol
ppm.tol
- mz.ppm.thr
mz.ppm.thr
- xlab
xlab.
- ylab
ylab.
- col1
Color 1.
- col2
Color 2.
- title.size
title.size
- lab.size
lab.size
- axis.text.size
axis.text.size.
- legend.title.size
legend.title.size
- legend.text.size
legend.text.size
- interactive_plot
Interactive plot or not.
Value
Return a MS2 spectrum.
Examples
spectrum1 <- data.frame(
mz = c(
87.50874,
94.85532,
97.17808,
97.25629,
103.36186,
106.96647,
107.21461,
111.00887,
113.79269,
118.70564
),
intensity =
c(
8356.306,
7654.128,
9456.207,
8837.188,
8560.228,
8746.359,
8379.361,
169741.797,
7953.080,
8378.066
)
)
spectrum2 <- spectrum1
ms2_plot(spectrum1, spectrum2)
 ms2_plot(spectrum1, spectrum2, interactive_plot = TRUE)
ms2_plot(spectrum1)
ms2_plot(spectrum1, spectrum2, interactive_plot = TRUE)
ms2_plot(spectrum1)
 ms2_plot(spectrum1, interactive_plot = TRUE)